An updated response to Vaush’s ultimate research document, with new sections on statistics, sex reassignment surgery and causes for black crime.
THERE’S A NEW VERSION:
Almost a year ago, a couple of friends and I got commissioned to work on a response to a Google Document (click here) by the Youtuber Vaush. This response was specifically made for his racism in the criminal justice system section. A few days after we made it, we decided to release it to the public incase others wanted to see it, and since then it has gained some steam among Leftists and *some* right wingers. Since then, people in Vaush’s discord have commented on it but have not made a single response to it, but one guy on Reddit did (see his comment here). I commend the guy for actually making a decent response, so I’ll include more in this updated response to respond to what he said. Regardless, it’s been almost a year since I uploaded the original response to my blog, and I have decided to make a more updated response; more studies, better explanations, and a few sections here and there to explain some basic concepts.
I also was not a fan of the original response, especially in respects to the flow of it all as in some sections it got “dirty.” So, all this is basically to fix some stuff I did not like in the original, and include more explanations for the statistically challenged. This is basically a short introduction explaining why I am remaking this, and to inform readers that I’m making some sections to help some of them understand the topic at at hand and the statistics behind it. Regardless, the first section will deal with some basic concepts in statistics, and then the 2nd section will discuss the issue of racism criminal justice — more specifically, a response to the cited studies in the document. Readers familiar with elementary statistics can skip the following section and skip on the response section, but those who need a refresher or a quick guide can continue as normal. Not all that is discussed in the statistics section will show up for every discussion, but it’s important to know some of these stuff as they may nor may not appear from time to time here.
As said above, this updated response is cleaning up things I did not like in the original response, and to flesh out some sections. The biggest update to this is the inclusion of a discussion on statistics, black crime, and the validity of sex reassignment surgery. This is primarily focused on systemic racism, group differences, and transgenders, so some stuff in Vaush’s doc has been left out because it is irrelevant.
Sampling
Sampling in statistics simply means selecting a group in which you’ll collect data from. When doing a study, we want to choose a population first and then get a sample from that population to study. A population is an entire group of people who we want to draw conclusions from, and a sample is a specific group of individuals from that population who we will study. Remember: A population can be defined in terms of geographical location, age, income, and many other characteristics.
Example:
Researchers want to see how watching TV influences teenagers in California. To study the effects of TV consumption, researchers gather a sample of 300 teenagers from California and give them a survey to see how watching TV has influenced them.
Population: Teenagers in California
Sample: 300 teenagers from California
We can’t study everyone in a population, so that’s why we have a sample. When collecting a sample, we want it to be as representative of our population as close as possible. This is why we do random samples. Random samples are people taken from a population at random, sort of like picking names out of hat. When we have random samples, our results will be more accurate because they’re not biased. There’s different types of sampling, some good and some bad, that will be detailed below
Good Samples:
- Simple random sample: Every member and set of members has an equal chance of being included in the sample. Technology, random number generators, or some other sort of chance process is needed to get a simple random sample. Random samples are usually fairly representative since they don’t favor certain members
- Stratified random sample: The population is first split into groups. The overall sample consists of some members from every group. The members from each group are chosen randomly.
- Cluster random sample: The population is first split into groups. The overall sample consists of every member from some of the groups. The groups are selected at random
- Systematic random sample: Members of the population are put in some order. A starting point is selected at random, and every nth member is selected to be in the sample.
When our sample is representative of the population we are trying to measure, it yields results that are more applicable to the population we are trying to study.
Bad Sampling:
- Convenience sample: The researcher chooses a sample that is readily available in some non-random way. (Ex. choosing a sample of people who live in your home since they’re readily available and aren’t random people)
- Voluntary response sample: The researcher puts out a request for members of a population to join the sample, and people decide whether or not to be in the sample. (Ex. A researcher asks gay couples at a bookstore to join his study)
These types of samples are not representative, meaning that they do not reflect the population we are trying to study because they lead to bias. In this context, bias means that certain people are being favored and these people may not be representative of the population. Thus, the results will be biased, and our findings are only applicable to our sample and not the population we want to study.
When doing a study, we want our study to be random and large. The bigger our sample size, the more accurate out findings will be towards our desired population. There is no golden number for how big a sample size should be, but anything typically larger than 100 is okay if the sample was random. Larger samples will yield more accurate results. Smaller samples can still offer us some insight, but not enough for it to be representative.
Regressions & an R Coefficient
A statistical staple in things like psychology and other areas of the social science field is the regression lines and the r coefficient. A regression line, also sometimes called a trend line, is a line that best fits the data and it’s typically linear. In this, X is the explanatory variable and Y is the dependant variable. Another way to think about it is by thinking that Y, the dependant variable, is the effect, and X, the independent variable, is the cause. So Y depends on X, and a change in X can cause a change in Y. Let’s look at an example by Levin (1997):

As we can see, an increase in height means an increase in calorie intake. So the correlation overall between height and calories in 0.8. In order to interpret what this coefficient number means, we can see what the statistician Jacob Cohen proposed:
| Small | 0.10 to 0.29 |
| Medium | 0.30 to 0.49 |
| Large | 0.50 to 1.0 |
So when looking at the correlation between height and calorie intake, we get a large correlation. Readers should remember that a correlation for Pearson’s R can be negative or positive, depending on the slope in the regression. An r of 1.0, for example, means that there is a perfect correlation between X and Y, but an r of -1.0 means a perfect negative correlation.
That r2, as seen under the graph, simply means how much of the dependent variable can be explained by the independent variable. To get r2, simply square Pearson’s r. In this case 0.8 x 0.8=0.64.
Correlation & Causation
No matter how many statistics classes you take, or how many internet arguments one gets in, it’s common to here that “correlation does not equal causation.” For example, the correlation between hours spent studying for a test and the grade you get on it may not be evidence of causation, especially since we can not prove that you studying led to you getting a certain grade. Although this is true, the effect size strength allows us to see if there is a casual association between the two variables we’re looking at. Although it does not show us causality, it may suggest an association between the variables we’re examining depending on it’s strength.
This brings us to what is known as a spurious correlation. A spurious correlation refers to a connection between two variables that appears causal but is not. For example, the correlation between premarital sex and negative health outcomes may appear causal at first, but controlling for confounding variables may show that there is no relation between the x and y variable after further controls are imposed. Those who have premarital sex may have more negative health outcomes, but is this due to premarital sex itself or other variables that have not been controlled for? It’s important to control for confounding variables when possible.
Effect Sizes & Statistical Significance
Effects sizes are simply ways of quantifying the difference between two groups. The greater the effect size, the greater the difference between whichever groups we are looking at, and the smaller the effect size, the smaller the difference between the groups we are analyzing. The most popular effect sizes, and the ones you really only need to understand when reading this, is Pearson’s r and Cohen’s d. There are other types of effect sizes, but I am tailoring this to fit what is required to understand this article.
Pearson’s r
As noted above, Pearson’s r coefficient tells us the strength between two variables. The correlation can only range between -1.0 and +1.0. Due to this, we can interpret Pearson’s r as an effect size. To determine the effect size for r, refer to the table given above.
Cohen’s d
Cohen’s d is the difference between two population means. It allows us to see the difference between the populations we’re looking at via their means. This is not a statistics class, so I won’t teach you how to calculate it. Instead, you can refer to this online calculator that does it for you (click here). To interpret how strong the effect size for Cohen’s d is, we can use this interpretation for effect size strength from Cohen (1992):
| Range | d effect size strength |
| 0 – .19 | Weak |
| .20 – .49 | Small |
| .50 – .79 | Medium |
| .8 or higher | Large |
Sometimes, researchers do not give us Cohen’s d, and thus we can’t see if the difference between two groups is small, medium or large. Luckily, if they supply a SD, mean value, and sample size, we can use the calculator up above to see it for ourselves.
Statistical Significance
Statistical significance helps us see if results are not due to chance alone. When something is “statistically significant”, that means our results were not due to chance–but if it’s not statistically significant then it was due to chance. For example, let’s say that the correlation between computer use and IQ is r= .5. If we were to run statistical hypothesis testing and found that the correlation is not statistically significant, then it means our correlation was due to chance.
Statistical significance is provided to us by something called a p-value. The p-value is the probability of how likely our result occurred by chance alone. If the p-value is small, it means the result was unlikely to have occurred by chance alone, and is thus statistically significant. A large p-value means the result is within chance or normal sampling error (i.e., the results occurred by chance). P-values range from 0 to 1, just like Pearson’s r. To interpret if a p-value is significant or not, we have to compare it to something called alpha (α). The two most common levels of α is α = 0.5 and α = .01. Alpha is decided by researchers beforehand.
If we use the two levels of α above, we can see when p-values are significant or not. If α = 0.5, for example, then p < α means the test is significant and p > α means the test is insignificant. The same rule applies to α = .01.
Unfortunately, many social scientists rely upon statistical significance to see if results are important or not. However, Cohen (1990) has stated that “I have learned and taught that the primary product of a research inquiry is one or more measures of effect size, not p values.” The American Psychological Association has noted that researchers should “Always provide some effect-size estimate when reporting a p value” (Wilkinson and Task Force on Statistical Inference 1999). The reason for this is because statistical significance alone does not tell us much, especially since an effect can be there even if hypothesis testing tells us that our results are not significant (see Wasserstein, Schirm, and Lazar 2019). I agree with Cohen, and thus will rely on effect sizes when they’re given or calculated instead of just seeing if the results are significant or not. This is why I gave a discussion on effect sizes, something I should’ve done in the last version of this response.
Now we’ve come to the section everyone wants, the response. This section will be formatted rather simply. Anything in bullet points will be what was said in the document, and what follows (i.e., what’s not in bullet points) is the response to the claim made and the studies used. Any claim that is similar to another claim will be included in the same little sub-sections, and sometimes some claims will be responded to in different sections and so I’ll tell you to go to that section for a response to that so there is no redundancy. Here’s an example of the format:
- Study Link
- Claim made
My response
Introduction Studies
- https://www.sentencingproject.org/wp-content/uploads/2015/11/Black-Lives-Matter.pdf
- Extensive document on racial biases in our criminal justice system.
- Studies seem to indicate about 61-80% of black overrepresentation in prisons can be explained by higher black crime rates, with the unexplained portion largely attributable to racial bias.
- Remember – the factors which lead to disproportionate criminality amongst black Americans are also in large part a product of racial bias. Underfunded public programs, redlining, generational poverty, bad schooling, and myriad other factors which influence criminality can also be traced to racial bias.
The documents presented by The Sentencing Project attempt to compare arrests to % of prisoners in prison, or by looking at some measurement of crime and arrests rates. Since there is some unexplained variance, it’s attributed to racial bias without evidence. Let’s take at the first cited study in this document, Tonry and Melewski (2008). After comparing UCR data to prisoners by race %s, they found that a 38.9% disparity that could not be explained, replicating a previous study that used the same crime database as them. The 2nd study cited, Blumstein (1993), found a 20.5% disparity that was left unexplained with the same methodology as the first study. The 3rd study, Langan (1985), looked at NCS data, inmate surveys, and admission census. It was found that the amount of blacks in prison was higher than the number of black offenders reported in the NCS. In 1979 and and 1982, 84% and 85% of the variance could be explained by black crime, leaving the rest to possible racial bias. As the paper says, there may be other explanations as to what explains the remaining disparity which is not racism; as the footnote says,
Regional differences in the imposition of sanctions may account for these differences since blacks may be concentrated in regions of the country where prison sentences are relatively common among convicted offenders (blacks and whites alike). If that is the case, statistics for the nation could indicate that the probability of imprisonment is higher for blacks than whites even in the absence of racial discrimination in justice administration. Another explanation is that blacks may have on average slightly longer criminal records than whites, thereby increasing their chances of receiving a prison sentence. Other legitimate explanations of these percentages are discussed by Blumstein, supra note 2, at 1268-70.
As can be seen, the author does not fully endorse racism as an explanation and offers alternative hypothesis. Like the studies cited before this one and the others that follow, the authors do not test to see if racial bias can explain the remaining disparity. All they do is argue that racism could be an explanation, but offer no statistical tests to see if they’re correct. This will be explained later, but let’s continue. The final study cited is Blumstein (1993), but I have been unable to find an online version of this paper to see what data was used. Regardless, none of these cited studies can prove racism is to blame.
As was already noted up above, the researchers do not prove that the remaining disparity can be explained by racial bias. All they do is find that there is a disparity left, say it could be because of racism, and that’s it. No models are used to test this hypothesis, but readers gobble it up and say the remaining portion is “largely attributable to racial bias.” No statistical model is ran, no test is used to see if this is true, just an interpretation of the data by the author. It’s up to the authors to actually prove that this is the case, not to assume it is. Readers, especially those who watch Vaush, may find what I just said asinine, but it’s the truth. Either run a model to test your racism hypothesis and see if the results confirm your hypothesis, or do not make the claim. Unfortunately, what I said doesn’t matter since the researchers have a fancy degree and they’re authority figures, so degrees matter more than evidence.
To continue, though, studies looking at the NCVS and official crime databases yield essentially similar racial differences as do official statistics (La Free 1996, in Hawkins 1995; Wilbanks 1987). For example, after examining data over a 3-year period, O’Brien (2001, in Walsh and Ellis 2006) found that crime reports matched up with crime arrests for race, meaning that blacks were being arrested at the same rate that they committed crimes (see Wilson and Herrenstien 1985 for more). Harris (2009) found that the overrepresentation of non-whites in jail reflects their crime rates. A more recent study provided by the original Reddit comment noted that these studies still found an unexplained disparity, but as has already been noted above, they do not test to see if the remaining disparity can be explained by racism or not. John may tell Bill that 85% of the reason he got into NYU was because of his grades, but the remaining 15% could be due to his race. Bill is right to say that John can not prove this, and no amount of hypothetical arguments can prove this either without him testing his hypothesis. If the remaining disparity is due to racism, then it’s up to the supporters of this view to run a model to see if this is the case, the fact that none have done so is odd. Furthermore, it’s unknown if the data is only looking at inmates who went to jail for a certain year and then comparing it to the crime rates at that specific year; or if they’re looking at the total amount of people in jail and then comparing it to crime rates. If it’s the latter, then we should expect the data to be inflated since some people may be in jail for crimes not captured during that years crime statistics, especially if they have been there for years prior. Regardless, there is a remaining disparity, but this can not be pinned onto racism as the document asserts without actual evidence that this explains the remaining disparity.
Reasons for Black Crime
In the original edition of this response, the issue of why blacks commit more crime was not discussed. When working on this new response, I didn’t want to include it, but further thinking led me to discuss the issue on the reasons for black criminality. According to Vaush, the reason blacks commit more crime is due to “Underfunded public programs, redlining, generational poverty, bad schooling, and myriad other factors which influence criminality.” It’s unknown how some of these things lead to crime (e.g. how does redlining lead to blacks committing crimes?), but most likely there are interaction effects at play. For example, redlining may lead to blacks staying in poverty ridden locations, and the lack of resources leads to blacks committing crimes. Let’s discuss if this can explain black crime on closer inspection.
Generational Poverty
In the case of general poverty, the argument goes that historical sin has led to blacks being poor, and this lack of wealth was passed onto their offspring. Due to this, poverty is a reason as to why blacks commit more crimes. First, it’s important to discuss if poverty is leading to blacks committing crimes. In general, it’s agreed upon on that poor people commit more crimes. The question, though, is if poverty shares a casual relationship with crime. Although poor people do commit more crimes, this is not evidence of causality. Sariaslan et al. (2013) utilized a large sample of Swedish individuals born from 1975-1989. It was found that a 1 SD increase in neighborhood deprivation was associated with a 57% increase in the chances of being convicted of a violent crime. However, controlling for unobserved confounders made the association disappear.

After controlling for confounders, the association between neighborhood deprivation (poverty, basically) was shown not to be casual. So, once you control for familial confounding variables, the correlation between poverty and criminality is not casual as some have posited. So, although people in deprived areas may commit more crime, this is not because of deprivation. Similarly, Sariaslan et al. (2018) looked at a total of 526, 167 people in Sweden who were born between 1989-1993. Children of parents of the lowest income percentile were more likely to be convicted of a violent crime when compared to those born in a high income percentile.

Like the previous study, controlling for unobserved familial risk factors made the association go away–showing that there is no casual relationship between poverty and criminality, and the correlation between the two is spurious rather than casual. Furthermore, blacks and whites in similar economic conditions do not have the same level of crime. In a graph provided by Chetty et al. (2018), race differences in crime persisted even when comparing blacks and whites in the same income group. In fact, blacks in higher income ranks have similar crime rates as whites in lower income ranks (there was no difference when comparing white females and black females, but this isn’t an issue given that crime is primarily concentrated among men).

Zaw, Hamilton, and Darity (2016) found that rich black kids are more likely to go to jail than poor whites. A user on Reddit has responded to some claims I’ve made in this post, discussing the issue of richer blacks committing more crimes than poor whites. He claims:
The Zaw, Hamilton, and Darity study literally just doesn’t say what he claims it says. The study concluded that incarceration rates were higher at every level of income for blacks, not that rich blacks commit more crime than poor whites.
First of all, my claim on what Zaw et al. said is correct. I doubt he read the study since he also said, “If you want to do an actual debunk yourself, just look at the abstracts of the studies he cites.” Just read the study yourself, especially since abstracts can be misleading. Regardless, let’s look at this graph made from the data by Zaw et al.:

As can be seen, rich blacks are more likely to be incarcerated than poor whites. We can use incarceration rates as a proxy for crime since incarceration rates align with crime reports, as discussed in this article above. He also complains that some studies are uncited for the section talking about the economy and crime. Only one of them was uncited, which was Rubinstein (1992). A citation has been added to that source since I can’t find a version of it online.
And Wolfgang, Figlio, and Sellin (1972) remarked that in the 20th century, lower class blacks had higher levels of crime than lower class whites. Furthermore, the correlation between poverty and crime on a national scale is inconsistent: Ellis, Beaver, and Wright (2009) found that most studies show that crime rises when the economy actually improves: 17 found that crime rises when the economy improves, 10 found that crime rises when the economy is doing bad, 5 found no relationship between the two. Rubinstein (1992, “Don’t Blame Crime on Joblessness.” Wall Street Journal, Nov. 9) found that murder and robbery tend to increase when employment increase. In looking at predictors of violent behavior (which cause crime, duh!), poverty, the mother’s lack of education, and the mother’s unemployment were predictive for whites but not blacks (McLeod, Kruttschnitt, and Dornfeld 1994). Finally, race differences in crime persist even after controlling for socioeconomic status (Kornhauser 1978).
In conjunction with what was said above, percent black is a better predictor of crime than poverty when put into a regression. Kposowa, Breault, and Harrison (1995) analyzed crime variation across 2,078 U.S counties and found that the proportion of the county that was % black continued to predict crime even after controlling for county differences in poverty, divorce rates, income inequality, religiosity, population density, and age. This was true for both violent crime and property crime.


Templer and Rushton (2011) looked at crime across the 50 U.S. states and found that the percent of the population that was black was a stronger correlate than average income for murder rates (.84 v -.40), robbery rates (.77 v .06) and assault rates (.54 vs -.23) Income was a stronger correlate for rape rates than race, but the coefficients were weak. Rubenstein (2005) found a very strong correlation (r=0.81) between percent black and Hispanic of a state and the violent crime rate of the state. Conversely, the association between poverty and crime and unemployment and crime are 0.36 and 0.35, respectively. Other studies have also suggested this to be true (Beaver, Ellis, and Wright 2009):

All these lines of evidence cast doubt on poverty being role in black crime, especially when looking at the effect sizes.
Poverty may not cause crime, but why are blacks lagging behind whites in their wealth? Leftists often blame historical sin for this, arguing that discrimination and racism led to blacks not having access to things and thus they were unable to pass on their wealth, leading to generational poverty. As far as I know, there is no study that has shown that if blacks were not victims of historical sin, the black-white income gap would be small or nonexistent. Instead, it’s just story time with Leftists and them saying how “since this happened, it led to this and then this, and then that and a bunch of other things!” No piece of evidence is offered to show that if blacks weren’t discriminated against in the U.S., then they’d be at the same level or almost the same level as whites in respects to wealth. If anything, the null-hypothesis that racism is to blame for black poverty doesn’t hold up (see Last 2019). Some reasons blacks could be lagging behind whites in wealth and have a higher crime rate could be due to racial differences in behavior, something to be discussed below.
Redlining
In conjunction with generational poverty, redlining is argued to show how blacks were stuck in impoverished neighborhoods because they were denied loan. Due to this, blacks were stuck in impoverished locations which led to criminality and having lower wealth. As has already been noted above, the correlation between poverty and criminality is not causal, and controlling for income does not remove race differences in crime. In contrast to the standard left-wing argument, racial composition of a neighborhood does not correlate to the probability of someone getting a load once further variables are adjusted for.
Looking at data from Pittsburgh, Ahlbrant (1977) noted that race had no significant independent effect on loaning. Once socioeconomic status variations were controlled for, Dingemans (1979) found that ethnicity and age contribute little explanation on getting loans. Avery and Buyank (1981) that areas which where stably black and stably white did not differ significantly in loan rates once economic variables where held constant. Tootell (1996) looked at data from Boston and found that the racial composition of an area was unrelated to the proportion of loan applications that were rejected in the area. So, since race has nothing to do with loans once economic variables are controlled for, it’s doubtful that this can explain why blacks are in poverty.
Bad Schooling
When it comes to bad schooling, this is based on the assumption that blacks go to bad schools. This is dealt with in Last (2019). Does not need to be dealt with here.
Based on what Vaush has said in the past (e.g. this Youtube video), and even in the document I am responding to, it seems he takes race differences in crime to be due entirely due to the environment. Race differences, possibly, do not play a role — and if they do, then they’re environmental and not genetic. Since Vaush’s explanations for black crime do not explain the black-white crime gap, I will argue that race differences in social and psychological traits explain the disparity instead. These traits, once taken together, can possibly explain why blacks commit more crime, and why they lag behind whites in money. What follows next is a discussion on race differences in traits, and how they can explain the black-white crime/ wealth disparity.
Alternative Explanations for Black Crime
It has been shown that the inability or unwillingness to delay self-gratification affects many life outcomes. Using nationally representative samples, Moffit et al. (2012) looked at how well self-control measured in childhood predicted life outcomes at age 32 compared to IQ and parental socioeconomic status. Self-control was found to predict better health, more wealth, less criminality, and a lower chance of being a single parent. This held true even while IQ and parental socioeconomic status was held constant. Although, Moffit et al. found IQ to be a better predictor of wealth and adult socioeconomic status when self-control and parental socioeconomic status were held constant. Daley et al. (2015) looked at 16,780 British individuals and looked at how well IQ, childhood self-control, and class predicted adult unemployment. IQ and self-control both had a negative relationship with unemployment, and class failed to predict unemployment after IQ and self-control were controlled for.
Tangey, Baumeister, and Boone (2004) found that high self-control predicted a higher GPA, better social adjustment, less binge-eating and alcohol abuse, better relationships and interpersonal skills, secure attachment, and better emotional responses. This remained even after controlling for social desirability bias. Casey et al. (2011) looked at 60 individuals and remarked that those who showed lower self-control in preschool also showed lower self-control in their 20s and 30s. In a meta-analysis by Ridder et al. (2011), self-control was related to a variety of human behaviors like love, happiness, getting good grades, speeding, commitment in a relationship and lifetime delinquency. There was a small-medium relationship between self-control and outcomes, showing that self-control may not explain all of these variables fully, but it is a factor.
In a classic series of studies, Mischel (1958, 1961a, 1961b) found that black Trinidadian children given a choice between getting a smaller candy bar now or a larger one in a week tended, much more than matched white children, to choose the smaller, immediate candy bar. The difference between white and black children “so great as to make tests for the significance of the difference superfluous” (Mischel 1961a). Mischel reported undertaking the study because informants had suggested that “Negroes are impulsive, indulge themselves, settle for next to nothing if they can get it right away, do not work or wait for bigger things in the future.” Seagull (1966) looked at black and white 9 year olds who lived in New York City. Blacks and whites were offered the choice between being given a small candy bar now, or a larger one in a week’s time. Black children were more likely to ask for the smaller candy bar now than white children.
Herzberger and Dweck (1978) looked at a sample of 100 4th graders and asked them to rate prizes. After rating the prizes, the researcher showed the immediate prizes and and the delayed one. Per the study, “the choice pairs included: three nickels, two versus five nickels, two versus three nickels, a small candy bar versus a medium-sized candy bar, and a rubber ball versus an iron-on patch (the latter was inscribed with either ‘keep on truckin” or ‘try it—you’ll like it’).” Black children had lower self-control than white children even after controlling for socioeconomic status. Not all studies used candy, though.
In the mid 1990s, the U.S. government offered military personal two options for when they retired: A large lump sum of money now (immediate reward) or a yearly payment (delayed reward) which, overtime, will be more than the immediate lump sum of money. Warner and Pleeter (2001) looked at the data for 66,483 individuals and found that blacks were 15% more likely than non-blacks to take the immediate reward. Whites were .4% less likely than non-whites to take the immediate reward. Zytkoskee, Strickland, and Watson (1971) and Price-Williams and Ramirez (1974) featured Mexicans, whites and blacks. The choices varied slightly and consisted of the option of $10 now or $30 in a month’s time, a 5 cents candy bar now or a 25 cents candy bar in a month’s time. There was little difference between the Mexicans and blacks, both of whom preferred the immediate reward — white children preferred the delayed reward at a higher rate.
Castillo et al. (2011) had 82% of the student population of 4 middle schools in a poor Georgia school district. Subjects were asked if they want $49 now, or $49 + $x seven months from now. The x variable was positive and increased over time, so it would’ve been a lot of money. Black children had significantly lower control than white children. Andreoni et al. (2017) examined a total of 1,265 children who were asked if they wanted an immediate reward at the end of the day, or a larger reward the next day. The child’s race was significantly related to their level of patience and black children had lower levels of self-control than the white and Hispanic children. These differences weren’t explained by early assignment to school or parent preferences.
This attitude towards rewards can be described in a variety of ways: more rapid decay of reinforcement, unwillingness or inability to defer gratification, “extreme present-orientation” (Banfield 1974), impulsiveness, lower superego-dominance. In more crude terms, blacks are more impulsive than whites. Race differences in self-control matter since they could explain a variety of racial disparities. For example, Banfield argues that the primary cause of black poverty is because the lower class person lives from moment to moment– they are unable or unwilling to take account of the future or to control their impulses. Herrenstein and Wilson (1985) reported that poor blacks wanted to make a lot of money, but they left jobs if they were low paying while, ironically, saying that the work game is strong. W.J. Wilson also reported how blacks told ethnographers that their black unemployed friends were lazy; one person said that “many black males don’t want to work, and when I say don’t want to work, I say don’t want to work hard. They want a real easy job, making big bucks” (Wilson 1997). Lower self-control among blacks could partially explain why blacks are poorer than whites. Race differences in self-control can also help explain why blacks commit more crimes in the U.S. and all over the world (see Beaver, Ellis, and Wright 2009).
Race differences in self-control levels can also be moderately explained by genetics, especially since self-control is under some genetic influence. Beaver et al. (2008) found that the heritability of self-control lies at .56; Anokhin et al. (2011, 2015) found it to be at .30 at age 12, .51 at age 14, and .55 at ages 16 and 18; Isen et al. (2014) found it to be at .47. Recently, Willems et al. (2019) conducted a meta-analysis and found the heritability of self control to be .6. In conclusion, half of self-control can be explained by genes and races differ in self-control for genetic reasons and environmental reasons.
Given that self-control correlates with lifetime delinquency and income, two variables in which blacks and whites differ in, then this could be a factor that can help explain some of the reasons as to why blacks commit more crimes and have lower incomes. Adjusting for other variables does not close the gap, and still leaves it open — showing that environmental variables are not the reason as to why blacks have lower self-control. Along with self-control, or lack thereof, another mediating variable to help explain the black-white crime/ wealth gap is IQ.
As has been noted below and in other places, races do differ in mean intelligence. Whites, on average, have an IQ of 100 and blacks have an IQ of 85. This view is not heretic, and has in fact been supported in the overall scientific literature. Shuey (1966) in The Testing of Negro Intelligence reported on 382 studies involving 80 different tests administered on hundreds and thousands of black and white children, high school and college students, military personnel, civilian adults, deviates, and criminals. The average black IQ score in these studies were a bit below 85, and the average for whites was also a bit above 100. The average black-white difference was always close to 1 SD. Lynn (2011) reviewed hundreds of studies looking at race differences in IQ, and the black-white IQ gap was always 1 SD. Roth et al. (2001), which was a large meta-analysis which included more than 6,000,000 individuals, found that blacks score 1 SD lower than whites. Chuck (2013) looked at 100 years of testing done on black intelligence, and every study looked at found lower intelligence among blacks. Even The National Academy of Science reported that,
“Many studies have shown that members of some minority groups tend to score lower on a variety of commonly used ability tests than do members of the white majority in this country. The much publicized Coleman study provided comparisons of several racial and ethnic groups for a national sample of 3rd, 6th, 9th and 12th grade students on tests of verbal and nonverbal ability, reading comprehension, mathematics achievement, and general information. The largest difference in group averages usually existed between blacks and whites on all tests and at all grade levels. In terms of the distribution of scores for whites, the average score for blacks was roughly one standard deviation below the average for whites. Differences of approximately this magnitude were found for all given tests at 6th, 9th and 12th grades… The roughly one-standard deviation difference in average test scores between blacks and white students in this country found by Coleman et al. is typical of results of other studies” (Garner and Wigdor, 1982)
The American Psychological Association, which most people would agree is an authoritative source, even remarked how there is a gap between blacks and whites in intelligence (see Neisser et al. 1996). Since races differ in IQ, this could also help explain the high rates of black crime since IQ correlates with criminality.
Sources for the correlation between IQ and crime can be found here.
In 1914, the role of intelligence in crime was brought to attention by H.H. Goddard (1914) who found that the majority of people in prison were mentally deficient. After this point though, the relationship between intelligence and criminality was not only ignored, but unfairly rejected (see Hirschi and Hindelang, 1977). This was because of a paper by Edwin Sutherland (1931) titled “Mental Deficiency and Crime” where Sutherland argued that the cause of the association was because of poor testing conditions. He showed that as testing procedures became better, the correlation began to diminish itself. But, he wrongly assumed that over time, it would completely disappear.
Hirschi and Hindelang (1977) re-initiated the crime-IQ debate with a paper titled, “Intelligence and Delinquency: A Revisionist Review”. This paper fought against the sociological bias against the role of IQ in criminal behavior and adult delinquency and pulled from multiple studies available at the time to prove it is unjustified. Some of the most compelling data is explained in the following paragraph (all studies cited in the following paragraph can be found in Hirschi and Hindelang [1977]). First, they re-analyze data from Hirschi (1969) which had a sample of 3,600 boys from Contra Costa County, California. They find a gamma correlation of -0.31. Wolfgang et al. (1972) uses criminal data from 8,700 boys and splits them into groups by IQ. There was a clear association with a gamma correlation of -0.31 for whites and -0.16 for blacks. West (1973) uses data from over 400 boys from London. They find that one quarter of people with an IQ of 110 or higher had a police record whereas one half of people with an IQ of 90 or less had a police record. He concludes that IQ was a significant predictor of delinquency and that it survived as a predictor after controlling for variables such as family income and family culture. Toby and Toby (1961) showed “intellectual status” was a significant predictor of delinquency/non-delinquency, regardless of socioeconomic status. Finally, Hirschi and Hindelang report on data which shows that even self-reported criminal behavior correlates with criminality.
Spellacy (1977) looks at 40 violent and non-violent adolescent males and tests them on neuropsychological tests and on the MMPI scale. They tested the group on verbal IQ, performance IQ, and full-scale IQ (FSIQ). On FSIQ, there was a 12.4 point difference between violent and non-violent adolescents. The results were consistent across other tests of mental ability. Similar differences are analyzed by Holland, Beckett and Levi (1981) and Holland and Holt (1975).
Mears and Cochran (2013) used the NLSY data of white men and their AFQT scores and create an index of different forms of delinquency and how much the participants committed those forms of delinquency. They controlled for additional measures, like Cullen et al. in order to refine the correlation to AFQT scores as much as possible. But, instead of purely relying on regression analysis (as they explain it has issues for curvilinear data), they used GPS analysis. First, they provide the bivariate analysis results which show that lower IQ people to tend to commit more crimes, but once you are looking at people in the IQ range of 77-88, the propensity for crime drops off. Essentially, this implies an inverse U-shaped model. Then, when testing the relationship through GPS analysis, they do find an association where people in the 90’s IQ range commit the most crimes, but people below that and above that commit less crimes.
June Andrew (1982) uses digit span tests and verbal IQ scores for a young sample of delinquents. She finds substantial differences in both across non-violent delinquents and violent delinquents. Crocker and Hodgins (1997) follow a Swedish cohort of over 15,000 participants to age 30. The mentally retarded male participants were significantly more likely to have committed at least one violent offense, theft, traffic offense, or “other” offense. Similar results are found for women. A study by Oleson and Chappell (2012) actually looked at a sample of people of very high intelligence, or geniuses (mean IQ of the sample was 154.6). They found that even among geniuses, a statistically significant, negative correlation exists between IQ and use of violence, having killed another human (excluding warfare), and having kidnapped someone.
Diamond, Morris, and Barnes (2012) look at both individual IQ and prison-unit-level (different units of the prisons; groups) IQ and see if it relates to the amount of individual inmate violence. First of all, they find that the average IQ of prisoners is about 2/3rds of a standard deviation below that of the American population. This is line with other research that the IQ difference between criminals and non-criminals is about 8-10 points (Hirschi and Hindelang, 1977). Second of all, they find individual IQ negatively correlates with individual inmate violence and that differences in prison-unit-level IQ negatively predicts the amount of individual-level violence. This may be somewhat in line with the theory I presented earlier that group IQ differences matter more to variation in given outcomes than individual level IQ differences.
Lynam, Moffit, and Stouthamer-Loeber (1993) argue low IQ is a solid, causal predictor of delinquency. This is done through specific procedural measures such as using younger boys, so as to avoid the effect of prison lifestyle on intelligence, as well as controlling for test motivation. The latter procedure is done to combat the hypothesis that the delinquency-IQ correlation can be mediated by the fact that delinquents do not seek to do well in life and will not care about their results on a test. Additionally, multiple studies have shown that the IQ of delinquents was low before said individuals became delinquent (Denno, 1990; Moffit et al., 1981; West and Farrington, 1973). The present study used self reports to measure delinquency in the boys and controlled for social status, race, and test motivation to ensure the correlation remained regardless of these variables. A correlation of r=-0.22 is found for FSIQ and delinquency. Impulsivity mediated relatively little of the relationship; school achievement did not have any effect on the relationship for whites whereas it mediated the association for blacks.
Hodges and Plow (1990) and Ward and Tittle (1994) also control for both SES and race and find that low-IQ remains a significant predictor for delinquency. Wolfgang, Figlio, and Sellin (1972) compare one-time offenders and chronic offenders in intelligence. They control for SES and race and still find an 8.1 IQ point difference for whites and a 10.6 point difference for blacks. The latter difference is particularly interesting because most studies find a smaller association between IQ and crime for blacks (Hirschi and Hindelang, 1977; Lynam, Moffit, and Stouthamer-Loeber, 1993).
McDaniel (2006) used NAEP data to estimate the average IQ of different states. He finds a correlation of r=-0.58 for state IQ and violent crime rate. Bartels, Ryan, Urban, and Glass (2010) use state IQ estimates to create estimates on the relationship of IQ to criminal behavior. They sought to replicate and extend upon McDaniel (2006) by looking at various types of crimes at the state level. Bartels et al. find, like McDaniel, a correlation of r=-0.58 for state IQ and violent crime, despite the years tested being different. They extend with the following, significant correlations of -0.57 (murder), -0.29 (robbery), -0.41 (assault), -0.45 (property), -0.57 (burglary), and -0.29 (theft). McDaniel (2006) was also replicated by Pesta, McDaniel, and Bertsch (2010) who found states with lower average IQs had higher aggregate crime rates. They found a correlation of r=-0.76 between overall crime rate and state IQ estimates.
Templer and Rushton (2011) analyze data from the fifty United States on IQ and criminal behavior. IQ was correlated with murder at r=-0.64, robbery at r=-0.46, and assault at r=-0.47. Beaver and Wright (2011) look at over 200 counties and their IQ estimates. The correlation matrix can seen below in Table 1: primarily the violent crime rate was correlated with IQ at r=-0.58, the property crime rates was correlated at r=-0.40, the aggravated assault rate was correlated at r=-0.52, and the composite crime rate was correlated at r=-0.53.

Gendreau, Little, and Goggin conducted a meta analysis of 131 studies (1,141 correlations) on the relationship between specific factors and adult recidivism. “Intellectual functioning” had a mean correlation of r=0.07. This relationship was stronger than the SES-Crime relationship, but worse than most others. Kandel et al. (1988) finds that IQ is a protective factor against criminogenic, environmental differences and, in effect, reduces risk of criminality. Many others have agreed with the hypothesis that IQ indirectly affects criminality through causing criminogenic factors such as Herrnstein and Murray (1994), Magdol, Moffit, Caspi, and Silvia (1998), and Ward and Tittle (1994).
The 2009 edition of the Handbook of Crime Correlates finds a large number of studies on the correlation between IQ and criminality (Beaver, Ellis and Wright, 2009). They find that the supermajority find a statistically significant, negative association. Some fail to find a statistically significant association, and very few find a positive association. These results were the same for official offending, self-reported offending, and various forms of psychopathy related to criminal behavior. Additionally, the type of IQ matters; performance IQ has a stronger association than does verbal IQ, but both negatively predict criminality.
Ellis and Walsh (2003) review the international data on IQ and crime; of 68 studies on IQ and delinquency, 60 found statistically significant, negative relationships. The other eight only reported statistically insignificant relationships. Of 19 studies on adult offending and IQ, 15 found statistically significant, negative relationships. Of the 17 studies on self reported and IQ offending, 14 found a statistically significant, negative relationship. Of the (19) studies on the effect of IQ on antisocial personality disorder, all found a statistically significant, negative relationship. Additionally, the international meta analysis provided by the newer edition of the Handbook of Crime Correlates (Ellis, Farrington, and Hoskin, 2019) finds that far and wide, the majority of the studies show a statistically significant, negative relationship between official offending and IQ. Some studies were statistically insignificant and very few showed a positive relationship.
One criticism may be that low-IQ offenders are more likely to be caught, and thus the relationship between low IQ and criminality is an result of this issue. One study found that this was not the case, and that criminals that aren’t caught still have low IQs (Moffit and Silva 1988). Furthermore, controlling for SES still shows criminals to be low IQ (Jensen 1998).
Along with crime, IQ can also help explain some of the reasons as to why blacks earn less than whites and why blacks are in poverty. First of all, income is heritable, as found by twin studies. Hyytinen et al. (2013) looked at 19 previous samples in which the heritability of income was estimated. 42% of the income variation could be attributed to genes, while 9% was due to non-shared environments. It’s possible that blacks and whites could differ in genes associated with income, with whites having genes associated with higher income and blacks with genes associated with lower income. Regardless, Strenze (2007) looked at over 100,000 individuals and found that IQ correlates with income was at .22. This is important because IQ is a better predictor of someone’s socioeconomics in the future than their parents socioeconomics (Strenze 2007). Palmer (2018) also found that IQ was a better predictor of someone’s SES and poverty than their parental SES.

Since IQ is associated with income, it’s no surprise to see that controlling for IQ cuts the black-white difference in the probability of being in poverty and wages in half (Murray and Herrnstein 1997):


As can be seen, a large portion of the black-white differences in wages and being in poverty can be explained by IQ. The rest of the remaining disparity could be attributed to the race differences described above and below.
Another possible cause for black crime is race differences in MMPI scores. The Minnesota Multiphasic Personality Inventory, or MMPI, is a test that assesses an individual’s personality and psychopathology. In the book MMPI Patterns of American Minorities, it’s discussed how blacks score higher on psychopathy, schizophrenia, and on hyperactivity scales (Dahlstrom, Lachar, and Dahlstrom 1986). Gynther (1968) remarks how these findings are interpreted to show “estrangement and impulse-ridden fantasies … unusual thought patterns and aspiration-reality conflict,” and Dahlstrom, Lacher, and Dahlstrom note that the high score of blacks on hypomania indicate “outgoing, sociable, and overly energetic patterns; tendencies to act impulsively and with poor judgment.” Jones (1978) looked at 226 black and white junior college students and administered the MMPI and California Psychological inventory. Their results can be seen below:

As Jones remarks, “Blacks reported themselves as more dominant and poised socially, fundamentalist in their religious beliefs, concerned with impulse management, self-critical, psychologically tough, cynical and power oriented, conventional in moral attitudes, and conformist that Whites. Blacks also reported themselves as less adventuresome and likely to take risks, and less vulnerable and tender psychologically (an interaction effect suggests this is particularly true of Black males than whites).” White male scored higher on unconventional morality, meaning that their behavior is considered beyond conventional sexually and ethically, but this doesn’t align with reality given race differences in moral reasoning tests, something to be discussed below.
When it comes to women, black women scored higher on social dominance, compulsive-orderliness, self-criticism, psychological toughness, risk-taking, cynicism and power orientation, and conformity. Both black and white women tended to report themselves as more religious, and conventional in moral attitudes. These race differences held true even after holding socioeconomic status and years of education constant. Similar findings for women have been noted in another study.
Harrison and Kass (1967) looked at pregnant black and white females. It was reported that “Negroes reported themselves as more religious, intellectual, romantic, cynical, impulsive in fantasy, fearful, estranged, sociable, concerned with dreams, orderly, and somatically tense than whites and less masochistic, free of aberrant behavior, indulgent in minor crimes, self-conscious, and antagonistic toward school than whites.” A table for their findings show the differences found:

MacDonald and Gynther (1963) also found race differences in MMPI scales:

Race differences were smaller when looking at the high social class groups (1-2), but the differences in MMPI scale scores get more pronounced depending on the scale being measured and the social class. An issue with this is that blacks scored higher on L, which is the scale that checks if you’re lying when taking the MMPI test. Based on Cohen’s d, the differences are large (black-white male difference d=0.9; black-white female difference: d=0.7) and the smaller race gaps could be an artifact of blacks lying on the test. Regardless, the conclusion of racial differences in MMPI scores show that blacks are more cynical, have greater mistrust, conflict with authority, and “externalization of blame for one’s problems.”
After controlling for social status, IQ, and levels of education, the differences in MMPI scores go away. This does not mean that MMPI differences are a result of theses variables, rather that traits scores may also affect status and levels of education. For example, conflict with authority can stop advancements in social status and levels of education. Controlling for these variables may make the differences go away, but this does not mean the differences are simply artifacts. Some commentators have also made the claim that the MMPI test is biased against nonwhites, but the evidence does not support this (Prichard and Rosenblatt 1980).
Going back to morality, we should not assume blacks and whites are equal in their ability to morally reason. One way to measure someone’s ability in moral reasoning is to give them a test where the lead actor is confronted with a moral dilemma. The respondent is supposed to choose the proper action consistent with it. When it comes to these tests, delinquents preform poorly on them (Raine 1993). Not surprisingly, these tests have also found race differences. In a sample of 1,322 junior high school students, their mean score was 21.90 with a standard deviation of 8.5 (Rest 1979). In a study by Preston (1979, cited in Rest 1979), blacks got a mean score of 18.45, showing a weaker moral understanding with a Cohen’s d of 0.41. In a sample of 8,782 people, blacks were more likely to endorse statements such as “laws are made to be broken”, “there is no right or wrong ways to make money”, and “it is okay for a teenager to have fist fights.” The same has been found in blacks from Trinidad (d=-0.45 [Rest 1986]) and in Jamaica (d=-0.51 [Gielen et al. 1989, in Adler 1989]) when compared to whites. Since blacks score lower in tests that measure ones moral understanding, it’s no surprise that they are more likely to commit crimes.
- Investigation of the Ferguson Police Department
- Between 2012 and 2014, black people in Ferguson accounted for 85 percent of vehicle stops, 90 percent of citations and 93 percent of arrests, despite comprising 67 percent of the population.
- Blacks were more than twice as likely as whites to be searched after traffic stops even after controlling for related variables, though they proved to be 26 percent less likely to be in possession of illegal drugs or weapons.
- Between 2011 and 2013, blacks also received 95 percent of jaywalking tickets and 94 percent of tickets for “failure to comply.” The Justice Department also found that the racial discrepancy for speeding tickets increased dramatically when researchers looked at tickets based on only an officer’s word vs. tickets based on objective evidence, such as a radar.
- Black people facing similar low-level charges as white people were 68 percent less likely to see those charges dismissed in court. More than 90 percent of the arrest warrants stemming from failure to pay/failure to appear were issued for black people.
The issues in the Ferguson Report revolve around driving violations mostly, with the inclusion of small stuff like jaywalking, things like charge dissmals, and warrants. The issue of driving violations will be dealt with down below when talking about driving offenses, but the issue of charge dismissals is not racially biased. According to one study, “White males were no more likely than non-White males to have the charges dismissed” and “White females, in other words, were less likely than non-White females to have all charges dismissed” (Guevara, Herz, and Spohn 2006). So, to the degree there is a racial bias, it seems to favor blacks when looking at females but nobody of any race when looking at males.
Stops, Searches, and Arrests
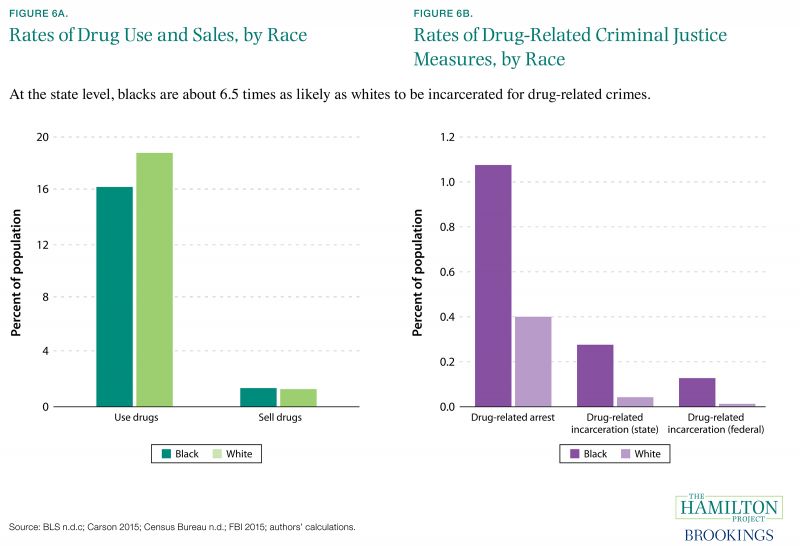
- The Concentrated Racial Impact of Drug Imprisonment and the Characteristics of Punitive CountiesWhile White & Black Americans admit to using and selling illicit drugs at similar rates, Black Americans are VASTLY more likely to go to prison for a drug offense.
- In 2002, Black Americans were incarcerated for drug offenses at TEN TIMES the rate of White Americans.
- Today, Blacks are 3.7x as likely to be arrested for a marijuana offense as Whites, despite similar usage.
- 97% of “large-population counties” have racial biases in their drug offense incarceration.
To know how these studies are done, all one has to know is that these studies get a large sample, and then ask the respondent if they have ever used drugs recently. From there, they usually compare drug use by race to arrest rates for drug offenses by race. So the first part (asking about drug use) is based on self-reported data. In credit to Vaush, it is true that studies have found that blacks and whites use drugs at similar rates, or that blacks have higher or slightly lower drug use than whites, but blacks are arrested more often for drug offenses. For example, Johnston et al. (2002) looked 43,700 students and gave them a questionnaire that asks about their drug use. According to Johnston et al., “Use also tends to be much higher among White students than among African American or Hispanic students.” Schanzenbach et al. (2016) reported that whites have a higher rate of drug use, as can be seen in the chart below, but black are arrested at higher rates.
Using data from SAMHSA, the ACLU reported that blacks report slightly higher cannabis use in the past month and past year, but whites report higher lifetime usage (50.7% for whites compared to 42.4% for blacks). Even though whites seem to use cannabis at higher rates overall, blacks are still arrested at higher rates for drug use (Edwards et al. 2020). Human Rights Watch (2009) remarked that blacks are more likely to be arrested for drug offenses, but this can not be pinned onto higher drug use among blacks since blacks and whites use drugs at similar rates (Gorvin 2008). Edwards et al. (2003) found similar results as the above 2020 revised report. Utilizing a probability-based sample of 4,580 college students who completed an online questionnaire, McCabe et al. (2007) found that Hispanic and white students reported higher drug use in college and before entering college when compared to blacks and Asians. The evidence seems quite clear, and to some only a fool would deny this as many analysis have found blacks to be more likely to be arrested for drug use even though nationwide data shows similar rates of drug use (see Owusu-Bempah and Luscombe 2020; Hughes 2020; SPLC 2018; see the report by the Justice Policy Institute).
Despite the overwhelming evidence showing this to be the case, these disparities are not a result of systemic racism. The null-hypothesis should not be that racism is to blame for these racial disparities, but rather it should be racial differences in how different racial groups use drugs and how often they do it. In reality, there is no reason to assume that the above findings are accurate for two strong reasons: [1] blacks are more likely to lie on self-report surveys, especially those that deal with crimes, and blacks are more likely to lie about their drug use when compared to whites, thus artificially decreasing their actual drug use rates; [2] racial differences in drug consumption can explain why blacks are more likely to be arrested for drug offenses, even if drug use by race is similar or lower for blacks.
Dealing with the first line of counter-evidence, criminologists have found that blacks are more likely to underreport their actual crime rates when asked. According to Cernkovich, Giordano, and Rudolph (2000: 143), there is “evidence that black males’ self-reports of delinquency are less valid than the reports of other groups: Black males underreport involvement at every level of delinquency, especially at the high end of the continuum.” Hindelang, Hirschi, and Weis (1981) report that self-reports are less valid for groups like blacks, with similar findings being remarked by Huizinga and Elliott (1986). Due to this, there is no reason to assume that blacks are being honest about their drug use. Although this is for crime in general, the same is true for drug use specifically. Page et al. (2009) did a urinalysis tests and asked the people in their study if they have used drugs recently.

After running a linear model, it was found that non-whites were more likely to say they have not used drugs recently when they in fact did. Falck et al. (1992) looked at 95 drug users and had them do a urine test after asking them if they had used drugs recently. In Table 3, they found that blacks were more likely to falsify their self-reports on opiate and cocaine use, as seen in the table below.

Feucht, Stephens, and Walker (1994) looked at 88 juvenile arrestees and had them do a hair test and urine analysis. In their urine analysis, blacks were more likely to lie about not using cocaine when they in fact did, as argued by Feucht and his colleagues when they said that “However, the higher rate of urinalysis cocaine-positive results for black arrestees suggests that the higher hair assay levels may actually indicate greater use of cocaine among the black arrestees in the sample.” Looking at marijuana, Fedrich and Johnson (2005) found a lower concordance rate within blacks, with the same being true for cocaine use.

Other studies have also found that blacks and non-whites are more likely to report lower drug use, even though testing them shows that they’re lying (see Miyong, Hill, and Martha 2003; Ledgerwood et al. 2008; Fendrich and Xu 1994). One study also found that blacks admit they they’d lie about drug use when asked, especially when compared to whites; 14% versus 6% for marijuana, and 19% versus 8% for heroin (Johnston, Bachman, and O’Malley 1984).
Furthermore, Ramchand, Pacula, and Iguchi (2006) noted that “African Americans are nearly twice as likely to buy outdoors (0.31 versus 0.14), three times more likely to buy from a stranger (0.30 versus 0.09), and significantly more likely to buy away from their homes (0.61 versus 0.48).” This shows that blacks are more reckless when buying drugs since it seems they’re more likely to buy it from someone they don’t know and use it outdoors where they can be caught, especially since these outdoor areas have higher crime rates where there is more police presence and blacks use drugs in areas with higher crime rates (Lagan 1995).
Some critics have pointed to this paragraph from Ramchand et al.:
“What these numbers show is that risky purchasing patterns among African Americans and their more frequent participation in transactions can account for only a relatively small amount of the observed differential in arrest rates. According to these calculations, Whites should still be arrested at a rate at least twice that of African Americans if the only thing driving these arrests were differential purchasing patterns. Instead, we observe in the real world that it is African Americans who are arrested at a rate that is twice that of Whites.”
This is supposed to show that differences in use and purchasing do not explain why blacks are arrested more often for cannabis consumption than whites. The issue is, it’s not supposed to. This line of evidence is supposed to be viewed with other lines of evidence, specifically lying about not using drugs. So, the reason blacks are arrested for drug use at higher rates is because they’re more reckless when buying and using drugs and they do them more often than whites. It just seems like they don’t do it more often because they lie on surveys. Not sure how this paragraph changes anything when you’re supposed to view it with other lines of evidence.
All these pieces of evidence, while viewed alone do not offer satisfactory explanations, do offer an alternative explanation when viewed together.
In conclusion, racism can not explain why blacks are more likely to be arrested for drug offenses. As has been noted above, these studies rely on self-reported data in which blacks are more likely to lie on than whites. The fact that drug testing shows opposite results from what places like the ACLU argue should cast strong doubt on the racism hypothesis. Racial differences in drug use and consumption also show that race differences in these areas can explain why blacks are more likely to go to jail for drug offenses than whites, even if drug use by race was similar or slightly higher for blacks. Purveyors of the racism hypothesis have yet to dispute these findings, instead relying on flawed methods of proving racism for racial differences in drug arrests.
- https://www.acludc.org/sites/default/files/2020_06_15_aclu_stops_report_final.pdf
- This ACLU report reviews 5 months’ of data from DC police stops & searches by race and outcome.
- The black population of DC is 25% greater than the white population, but black people were 410% more likely to be stopped by the police than white people
- This disparity increases to 1465% for stops which led to no warning, ticket or arrest and 3695% for searches which led to no warning, ticket or arrest.
- This data indicates the disproportionate stopping and searching of blacks in the Dc area extended massively beyond any disproportionate rate of criminality.
- The Problem of Infra-marginality in Outcome Tests for Discrimination
- Analysis of 4.5 million traffic stops in North Carolina shows blacks and latinos were more likely to be searched than whites (5.4 percent, 4.1 percent and 3.1 percent, respectively).
- Despite this, searches of white motorists were the most likely to reveal contraband (32% of whites, 29% of blacks, 19% of latinos).
- https://drivingwhileblacknashville.files.wordpress.com/2016/10/driving-while-black-gideons-army.pdf
- Between 2011 and 2015, black drivers in Nashville’s Davidson County were pulled over at a rate of 1,122 stops per 1,000 drivers — so on average, more than once per black driver.
- Black drivers were also searched at twice the rate of white drivers, though — as in other jurisdictions — searches of white drivers were more likely to turn up contraband.
- A large-scale analysis of racial disparities in police stops across the United States
- Enormous study of nearly 100,000,000 traffic stops conducted across America.
- Analysis finds the bar for searching black and hispanic drivers’ cars is significantly lower than the bar for white drivers.
- Additionally, black drivers are less likely to be pulled over after sunset, when “a ‘veil of darkness’ masks ones’ race”.
Before we continue, Vaush is correct to argue that blacks are stopped and searched more often than whites. This finding has been replicated in many locations across America, but there are few problems with this. To determine if racial bias may be present, researchers use a benchmark based on population demographics. For this benchmark, researchers compare the racial distribution for x to their groups total population. For example, say that in California 45% of people arrested for drugs are black but blacks are only 12% of the total California population. Since the racial distribution for drug arrests among blacks is higher than their total population, then this is evidence of racial bias since the two distributions do not align. Readers with an IQ of 90 can see how wrong this. First of all, we should not expect racial distributions to align for most stuff; second of all, blaming this disparity on racism doesn’t work unless it can be explained by racism with evidence — not just with the existence of a disparity. The null-hypothesis should not be that racism is the cause of the disparity, because if this is so then any racial gap is a product of sin rather than of differences.
Let’s take another example that relates to the topic at hand. Say that on the 105 freeway in Los Angeles 54% of drivers pulled over and searched are black, but blacks are only 23% of the Los Angeles population. Using the benchmark method used by many social scientists, they find that racism is responsible for this disparity since the two racial distributions (% black drivers stopped and their population % in L.A.) do not align and thus they must reflect racial bias. Instead of the social scientists seeing if racial differences in driving behavior can explain this disparity, they just argue that it’s because of racism because of their benchmark used. Because of this issue with this benchmark, it’s not exactly a good benchmark (see Ridgeway and MacDonald 2010 for more). Another benchmark used is the hit rate benchmark.
According to this benchmark, blacks being stopped and searched more is not a result of racial bias if their stop rates reflect their successful hit rates. If their stop rates and hit rates do not align — or rather their stop rate is higher than their hit race — then racial bias does seem to play a role. To repeat what I’ll say in the next following sections, hit rates do not matter. Say you’re a campus officer and there are people who wear blue backpacks and black backpacks. While patrolling the campus, you notice that those who wear black backpacks are more likely to commit campus violations/ show suspicious behavior. Due to this, you stop them more often and search them — but it turns out that those who wear blue backpacks are more likely to have contraband. Simply knowing their backpack color doesn’t help you see who to stop and search, but behavior and violations do. The final sentence will make sense in the following sections, but this will be repeated again near the end.
Overall, the evidence does suggest that non-white drivers are more likely to be stopped than white drivers. This is not an area of dispute, but the reasons for this disparity are. Regardless, let’s continue onto what the evidence for traffic stops by race tell us. Explanations for this disparity won’t be given in this section since this is more of a literature review, but it will be given in the next section.
Reviewing 5 months of data, the ACLU (2020) looked at D.C. police stops and searches by race. Black people made up 46.5% of the D.C. population but made up 72.0% of stops overall, 86.1% of stops that led to no warning or ticket, and 91.1% of searches that led to no warning or ticket. Although the ACLU does say that they really can’t say that this disparity is because of racism, they do say that it can be because of racism because (1) most black stops are unjustified; (2) blacks are more likely to be stopped in white areas and; (3) blacks are more likely to be searched than whites despite whites being found with contraband more.
Using a population benchmark, a California study by Durali et al. (2020) found that despite being 6.3% of the population according to ACS data, 13.4% of blacks were stopped by police. According to their findings, “a higher percentage of Black individuals were stopped for reasonable suspicion than any other racial identity group”:

Furthermore, blacks were searched more often despite whites yielding contraband at a higher rate than blacks. Blacks were also more likely to be stopped and arrested in the morning than at night, something called the “veil of darkness (VOD)” — when one’s race is masked at night. According to the VOD logic, this supports the hypothesis of racial bias since black drivers are less likely to be stopped at night when one’s race is harder to make out.
Looking at the San Diego Police Department (SDPD), Berjarano (2001) remarked that blacks only make up 8% of the San Diego population but 12% of all those stopped, and 14% of those stopped for equipment violations. Similarly, Zingraff et al. (2008) found that although blacks make up only 19.6% of licensed drivers in North Carolina, 22.9% of traffic tickets were issued to blacks. In Florida, blacks made up 22% of all seat belt citations but only 13.5% of the Florida’s drivers (ACLU 2016). These citation differences could not be explained by seat belt compliance since the difference in seat belt compliance between blacks and whites was not large enough to begin with (91.5% v. 85.8%). Similar results have been found in Maryland and Illinois (Harris 1999; ACLU 2014), with whites being more likely to be found with contraband in Maryland. One of the more popular studies comes from Lamberth (2010) in New Jersey. Despite blacks making up only 13.5% of drivers on the road, they made up 42% of those stopped by police.
In a more recent study looking at over 100 million traffic stops across America, Pierson et al. (2020) found that blacks and Hispanics were more likely to be stopped at higher rates than whites, more likely to be searched despite whites having more contraband, and blacks are less likely to be stopped at night than in the morning. This study, though, did not use a population benchmark and instead used the threshold test (Simoiu, Corbett-Davies, and Goel 2017). This test uses the rate at which searches occur and their success rate (i.e. they find contraband), with them finding that the bar to search non-whites is lower.
Looking at national data, Persico and Todd (2006) looked at 15 studies and looked at their hit rates, with Last (2019) making their table clearer and adding a difference(s) section:

As can be seen, there are regional differences in hit rates by race. Overall, whites have a higher hit rate (i.e. being found to have more contraband) than blacks, with the difference being 2.4).
Based on all this evidence, some would conclude that this disparity is due to racial bias in the criminal justice system. Indeed, this has been the position taken in some of the studies cited above, and in the media with them calling blacks being stopped and searched more than whites “driving while black” (e.g. LaFraniere and Lehren 2015; Brown 2019; Lartey 2018; Gold 2016). Good research does not just leave it here, it attempts to explain the findings instead of blaming it on a ghost (racism). Although blacks are more likely to be stopped and searched than white drivers, the racism hypothesis could be argued with racial differences in driving behavior.
Looking at the National Survey of the Use of Booster seats, we find racial differences in seat belt usage (Pickreall and Jianqiang 2009). These differences are larger between the ages of 13-15, and smaller in older age groups. Although we have these differences, they are not large enough to explain racial differences in driving stops — except at a younger age.

If non-whites live in areas where police aggressively enforce seat belt violations, then blacks will be more likely to be stopped.
While there seems to be very little data looking at racial differences in driving violations, the best evidence comes from criminologist Heather MacDonald. In the context of New Jersey and North Carolina, MacDonald (2016) notes:
“Though most criminologists are terrified of studying the matter, the research that has been done, in New Jersey and North Carolina, found that black drivers speed disproportionately. On the New Jersey turnpike, for example, black drivers studied in 2001 sped at twice the rate of white drivers (with speeding defined as traveling at 15 mph or more above the posted limit) and traveled at the most reckless levels of speed even more disproportionately.”
Unfortunately, I’m not aware of any more studies like this and it seems that racial differences in speeding aren’t generalizable besides in North Carolina and New Jersey. The BJS notes that whites are more likely to speed (Smith and Durose 2006), so it’s possible that races get stopped for different reasons. Indeed, races give different reasons as to why they’re stopped:

Another reason as to why blacks are more likely to be stopped is because they’re more likely to have a warrant out for their arrest and have unpaid tickets (Dolan 2016). A strong reason to assume that racial bias does not play a role in driving stops and searches is racial differences in suspicious behavior. If certain groups are more likely to display suspicious behavior, then cops will be more likely to stop and search them. According to the National Institute of Justice:
In Savannah, Ga., trained observers accompanied police officers on 132 tours and focused on officers’ decision-making and discretion prior to a traffic stop. Officers were questioned every time a person aroused their suspicions. Of those who evoked suspicion, 74 percent were male and 71 percent were minorities. Suspicious behavior, a traffic offense, “looking nervous” or similar behavior accounted for 66 percent of the officers’ reactions; 18 percent were the result of information they had received to be on the lookout for a suspect; 10 percent because someone was where he or she would not be expected to be; and 6 percent because of the person’s appearance. Officers stopped individuals under suspicion 59 percent of the time, but the suspect’s race did not affect the outcome of the stop. The authors concluded that the results did not support the perception that a high level of discrimination occurs prior to a traffic stop.
Citing Geoffrey et al. (2009)
Another interesting piece of data comes from Schell et al. (2007). Looking at Cincinnati, blacks had longer stops and higher search rates than white drivers. After controlling for time, place, and context of the stops, there were no differences on stop and search rates. If these same variables were taken into account for the previous studies which argue for racial bias, then it’s highly likely that they wouldn’t find racial differences in stops and searches. Ridgeway and MacDonald (2010) note that “A comparison of the racial distribution of observed traffic violators to actual police traffic stops in the same areas suggested little evidence of racial bias in stop decisions.” What about the ACLU’s findings that blacks were more likely to be ticketed and whites were more likely to be given a warning? After controlling for different variables, Smith and Petrocelli (2001) note that “minority drivers were more likely to be warned, whereas Whites were more likely to be ticketed or arrested.”
One of the more important things that should be responded to is the VOD findings. To give a quick refresher, the VOD refers to the fact that blacks are more likely to be stopped in the morning than at night when the driver’s race is harder to see. The original “sunset” and ”veil of darkness” study referenced in the Stanford paper study DOES mention work variances (i.e. differences by race that could lead to more blacks stopped by police in the day), which is a detail completely omitted in Stanford study. As the original veil of darkness study says,
“For a number of reasons, the assumption of constant relative risk is restrictive. One reason for this is that temporal travel patterns may vary by race due to differences in hours of work. If so, then the race distribution of the at-risk population may vary by time of day. Racial differences in police exposure or driving behavior could also cause the relative risks to vary.”
They also say that
“In the case of the Oakland data, our approach yields little evidence of racial profiling, and our sensitivity analysis suggests that the departures from our maintained assumptions would have to be substantial to overturn our conclusions”
Grogger and Ridgeway (2006)
It’s highly possible that the authors of the Stanford paper just made an assumption on what their data could mean rather than testing this hypothesis. Even the original VOD study found no racial bias and said that blacks being more likely to be stopped in the morning than at night can reflect relative risks. It should also be noted that another factor that could be causing blacks to think that them being stopped by a cop is due to racial bias is the fact that when stopped by an officer of a different race, they think that the stop was not legitimate when compared to when stopped by an officer of the same race (Langton and Durose 2013).
All these variables can lead to blacks being stopped more and being searched more, especially when there are racial differences in suspicious behavior when driving. If one exhibits odd behavior and gets stopped by an officer, it’ll increase their chances of also being searched. Bringing up hit race by race does not matter. Although whites are more likely to have contraband, police just can’t stop every white person. They have to stop someone who looks suspicious or who is committing traffic violations. To repeat myself, say you’re a campus officer and there are people who wear blue backpacks and black backpacks. While patrolling the campus, you notice that those who wear black backpacks are more likely to commit campus violations/ show suspicious behavior. Due to this, you stop them more often and search them — but it turns out that those who wear blue backpacks are more likely to have contraband. Simply knowing their backpack color doesn’t help you see who to stop and search, but behavior and violations do.
In conclusion, racial differences in driving violations and behavior explains why blacks are more likely to be stopped and searched, even though whites are more likely to have contraband on them. Contrary to media and political narratives, “driving while black” is a result of racial differences than of racial bias. This line of argument, while popular, does not make a good argument as to why blacks are stopped and searched more often than whites.
Judges, Juries & Prosecutors
- Demographic Differences in Sentencing: An Update to the 2012 Booker Report
- Extensive multivariate regression analysis indicates black male offenders receive 19.1% longer federal sentences than similarly-situated white male offenders (white male offenders with similar past offenses, socioeconomic background, etc.)
- This disparity seems to stem mostly from black males being 21.2% less likely to receive non-government sponsored downward departures or variances.Non-government sponsored departures and variances refer to deviations from standard sentencing guidelines due to judicial discretion.
- Black males who do receive non government-sponsored departures and variations still serve 16.8% longer sentences than white males on average.
- In contrast, when sentencing length follows standard guidelines, that disparity is only 7.9%, and a substantial assistance departure for both groups nullifies that disparity.
- IN SUMMARY – much of the sentencing disparity between similarly situated black males and white males comes down to judicial discretion to deviate from standard sentencing guidelines.
- BONUS – regression analysis suggests violence in a criminal’s history does NOT explain sentencing disparities between black males and similarly situated white males – the effect of that factor seems to be statistically insignificant.
- https://sci-hub.tw/https://onlinelibrary.wiley.com/doi/abs/10.1111/jels.12077
- A study of first-time felons in Georgia found black men received sentences of on average 270 days longer than similarly-situated white males.
- However, when black males were differentiated by skin tone, it was found light-skinned black men saw virtually no disparity in their sentencing while dark-skinned black men actually saw a disparity of around 400 days in prison.
The issue of racial bias in sentencing has been a long standing issue in criminology. In fact, there have been about 5 waves so far, according to Alexander (2014). The first wave had poorly done studies that found large amounts of racial bias (readers should keep in mind that this hypothesis is not tested, it’s based on the interpretation of what the remaining disparity could mean), the 2nd wave in the 1980s controlled for more things and found no racial bias, and the 3rd wave went to look at more things besides sentencing only. The 4th wave was just like the 2nd wave, but it found that the best done studies found little evidence of discrimination:
Langan’s interpretation matches those of other scholars such as Petersilia (1985) and Wilbanks (1987) in suggesting that systemic discrimination does not exist. Zatz (1987) is more sympathetic to the thesis of discrimination in the form of indirect effects and subtle racism. But the proponents of this line of reasoning face a considerable burden. If the effects of race are so contingent, interactive, and indirect in a way that to date has not proved replicable, how can one allege that the “system” is discriminatory?
The fifth wave found a decrease in racial bias, but still found racial bias. It’s unknown why there’s such a discrepancy in the literature, and why controlling for legal variables does not seem to close the gap. Regardless, other studies have also found support for the racial bias hypothesis and against it (e.g. Sweeney and Haney 1992; Everett and Wojtkiewicz 2002; for a discussion on how the race variable is not statistically significant and is manipulated by how researchers conduct their study, see Pratt 1998; Mitchell 2005 found the race variable to be statistically significant but small and highly variable). Even in the Mitchell study, though, racial bias was found. So, is there a variable that closes the gap to the point where it’s statistically insignificant? Yes.
As has been well supported by scientific institutions and the overall literature, races differ in average IQs (see Shuey 1966; Coleman et al. 1966; Garner and Wigdor 1982; Lynn 2011; Roth et al. 2001; Chuck 2013; Neisser et al. 1996). IQ also correlates with many social variables like educational attainment, income, job performance (Strenze 2006, 2015) and a bunch of other variables [readers who doubt the validity of IQ should know that it has a higher mean statistical power than other areas of science, like neuroscience and psychology, for example: in Last 2019]. Since IQ is a valid construct with predictive validity and is taken seriously, despite what some may lead you to believe, it should be asked if this variable can close the black-white gap in sentencing. Beaver et al. (2013) found that after controlling for past criminal record and IQ, the sentencing gap between blacks and whites became statistically insignificant, and this time it found the race variable to already be statistically insignificant like past studies.

Some commentators in the past have said that the 0.05 difference shows that there still is in fact a gap, but the gap is not statistically significant in the multivariate model after controlling for lifetime violence and IQ. Although it has been noted that effect sizes are better than statistical significance, that difference of 0.05 is very weak, and it’s doubtful race of the offender can explain these results. The remaining disparity can most likely be explained by legal variables. Starr and Rehavi (2012) 58,000 federal cases and found that 83% of the black-white sentencing gap can be explained by differences in criminal record, arrest offense, gender, age and location. The remaining disparity was a result of charging differences. (Starr and Rehavi 2014 found a 10% disparity, but that was due to charging differences.) Studies should look at legal variables, criminal record and IQ all together to see if the gap still persists. The fact that no study has done this is confusing, but it’s obvious the gap is most likely not due to racial bias.
When it comes to the Georgia study, the document failed to note that light-skinned blacks had lower sentences than whites.

Why this was omitted is unknown, but it’s unknown as to why light-skinned blacks have a smaller effect than whites. Regardless, this model can still be interpreted via a hereditarian hypothesis. Since light-skinned blacks are smarter than darker skinned blacks (Chuck 2008; Shuey 1966; Rowe et al. 2002; Last 2019), it would make sense as to why they get less harsher sentences than their darker counterparts. So even taking the effects of light-skinned blacks into consideration, it still falls inline with a hereditarian hypothesis and the findings by Beaver et al. So, it seems that much of black-white sentencing gap is a result of IQ differences, not racism in the criminal justice system.
- Racial Disparity in Federal Criminal Sentences
- Examination of federal data indicates Black Americans spend about 10% more time in prison when compared to comparable Whites who commit the same crimes.
- Additionally, Black arrestees are 75% more likely to be charged with a crime carrying a mandatory minimum sentence.
- Prosecutors contribute massively to this undeniable racial bias.???
- https://www.yalelawjournal.org/article/mandatory-sentencing-and-racial-disparity-assessing-the-role-of-prosecutors-and-the-effects-of-booker
- Black men are twice as likely to have charges which carry mandatory minimum sentences filed against them than similarly-situated white men.
- This article recommends against the tightening of judicial discretion, arguing that process has historically led to greater racial sentencing disparities.
The issue of blacks spending more time in prison has already been discussed above, but what about mandatory minimums? When mandatory minimum laws are in place, the black-white gap in sentencing is smaller (although, the gap itself is a result of IQ, as discussed above). The black-white gap may widen or remain persistent due to the elimination of rigid sentencing guidelines (mandatory minimums), thus sentences are lower for BOTH blacks and whites compared to decades past. It seems mandatory minimums kept sentencing racially “fair” in some respects (Pryor et al. 2002). It’s highly possible that blacks commit more crimes that carry mandatory minimums, especially given the fact that blacks commit more crimes than whites (Beaver, Ellis, and Wright 2013). So, blacks could be committing crimes that have a mandatory minimum sentencing attached to it, and this explain it, not prosecutors. (Personally, I was unsure why the last claim for the first study ended with question marks. Did the study make this argument, or is this a personal interpretation of the data?)
- Between 1990 and 2010, state prosecutors struck about 53% of black people eligible for juries in criminal cases, as opposed to 26% of white people. The study’s authors testified the odds of this taking place in a race-neutral context were around 1 in 10 trillion.
- After accounting for factors prosecutors select for which tend to correlate with race, black people were still struck twice as often.
- North Carolina’s state legislator had previously passed a law stating death penalty defendants who could demonstrate racial bias in their jury selection could have their sentences changed to life without parole. The legislature later repealed that law.
When looking at Table 13 of the study, the race variable had a positive coefficient of .906, and it was statistically significant at <.001. When controlling for all the variables that tend to correlate with race, and race itself, the entire R2 was 0.32, meaning it explained 32% of the variance into as why black jurors were struck down more often. Even when controlling for other variables that may be race neutral, there was still a disparity. Interestingly enough, another North Carolina study on jury selection found that defense attorneys struck down potential white jurors far more often than they did potential black jurors (22% vs. 10%). So, it seems that both races experience some form of “racial bias” in jury selection, and it seems to depend on whether a state prosecutor or defense attorney is the one selecting the jurors. If both groups seem to be affected, is it really due to racial bias? Makes no sense for race to be inconsistent in the face of systemic racism.
- In this study, two groups of mock jurors were given a collection of race-neutral evidence from an armed robbery, with one group’s alleged perpetrator being shown to be light-skinned and the other dark-skinned.
- Jurors were significantly more likely to evaluate ambiguous, race-neutral evidence against the dark-skinned suspect as incriminating and more likely to find the dark-skinned suspect guilty.
On a personal note, this study should not have been included. The sample used in this study was not even representative of actual jurors, and it had a small sample size. The sample for the study was 66 students from the University of Hawaii — not at all indicative of jury members serving under legal obligation. Regardless, the authors included a previous 2003 review that found no consensus in the literature for this issue (Sommers and Ellsworth 2003), casting doubt on if this study changes anything in that. Furthermore, the 2003 study also remarked that “Black mock jurors seem to be influenced by a defendant’s race regardless of the salience of racial issues at trial.” White jurors were less influenced by race, so racial bias is coming from blacks and not whites. Furthermore, other studies have found not anti-black bias from whites who acted as mock jurors, but did find a racial-bias from blacks.
Mitchell et al. (2005) analyzed data from 34 studies in which people acted as jurors and voted on whether a given defendant was guilty. It was found that whites have nearly no bias in such decisions while the black people exhibit an in-group bias that is 15 times larger than the minuscule bias seen among whites. Devine and Caughlin (2014) conducted a meta-analysis and found that white jurors had no bias against black defendants, but did have a moderate bias against Hispanic defendants. Black jurors, though, showed a pro-black or anti-white bias. Zigerell (2018) meta-analyzed 17 studies and found that white people exhibited a statistically insignificant tendency to favor black people while black people exhibited a pro black bias that was larger and statistically significant. So in conclusion, white seem to show no anti-black bias in mock jury studies, but blacks show an in-group bias or an anti-white bias. If systemic racism in jurors is argued to be stemming from whites against blacks, the data does not support this.
- https://bja.ojp.gov/sites/g/files/xyckuh186/files/media/document/PleaBargainingResearchSummary.pdf
- Government aggregate of data on plea and charge bargaining.
- “Studies that assess the effects of race find that blacks are less likely to receive a reduced charge compared with whites.”
- “Studies have generally found a relationship between race and whether or not a defendant receives a reduced charge.”
- “The majority of research on race and sentencing outcomes shows that blacks are less likely than whites to receive reduced pleas.“
- In short, collected data strongly indicates a racial bias against blacks with regards to sentencing and plea bargains.
- http://citeseerx.ist.psu.edu/viewdoc/download?doi=10.1.1.821.8079&rep=rep1&type=pdf
- Black defendants with multiple prior convictions are 28% more likely to be charged as “habitual offenders” than similarly-situated white defendants.
- “Assessments of dangerousness and culpability are linked to race and ethnicity, even after offense seriousness and prior record are controlled.”
It’s hard to know the effect race has on plea bargaining without knowing the effect size. If there is an effect to be measured, an effect size should be given to see how strong or weak it is. The issue is far more complex, though, and not as simple as the document paints it out to be. Metcalfe and Chiricos (2017) analyzed the effects of race and remarked that “Pleading guilty increases the probability of a charge reduction by 50.1% for blacks, as opposed to 55.8% for whites“, and that “blacks generally have slightly lower offense seriousness scores, more extensive prior records, and are detained at higher rates—all factors that decrease the likelihood of a charge reduction. This may partially explain the lower value blacks are getting for their plea.” “Aha”, some Vaush readers might say. “Your own quote from the study shows a bias against blacks, so Vaush was right!” No so fast, reader. After looking at the effects of both gender and race, the authors noted that “Pleading guilty increases the probability of a charge reduction by 46.1% for black males, compared to 58.1% for black females, 53.9% for white males, and 55.9% for white females.” It seems that the effects of gender are stronger than that of race, and black females benefit for than white males and females when pleading guilty. If the criminal justice system was racist in respects to plea bargaining, the effects should not differ by sex.
2nd study did find the results the document is claiming, as seen in Table 6 of the study.

Controlling for gender might show contrasting results to the racism hypothesis. As Steffensmeier and Demuth (2020) noted, female defendants who aren’t white are treated better than their male counterparts in criminal sanctioning. So, the 2nd study should control for gender and see if the effect still persists. Furthermore, if it seems to only affect males, it doesn’t make sense for racism to be the explanatory variable if it differs by gender.
- The Urban Institute analyzed the histories of four probation offices and found black people were 18-39% more likely than similarly-situated white people to have their probation revoked.
This study has significant limitations not mentioned by Vaush. As the study says, key variables were missing from the data set, making the analysis results constrained by what they were limited to:
Data on some key factors likely related to revocations were not available for analysis. In no site was the data sufficiently populated regarding violation type, including whether violations were related to new crimes or technical violations of probation conditions. This is a very substantial limitation, as the type of violation is strongly related to the likelihood of revocation.
We also did not have the data necessary to parse out the contributions of different decision points and actors to the disparity. Probation revocations are a product of probationer conduct, probation officer discretion, judicial discretion, and supervision conditions, making these four factors important determinants of which probationers experience a revocation. Other processes, such as law enforcement practices (which could detect more or less probationer misconduct) or policies and statutes (which could limit discretion in responding to probation violations), also play a role in many jurisdictions.
Given these limitations, conclusions regarding the drivers of observed disparities in probation revocations are provisional and constrained by the data available for this study
Why this omitted was unknown, and it’s clear the limitations do not allow us to see if racial bias even plays a role. Given probation officers do not treat blacks differently than whites, it’s doubtful that the higher probation revocation among blacks is due to racial bias (see Bechtold et al. 2015).
- A study of bail in 5 large counties found blacks received significantly higher bail than whites who had committed similar crimes.
- The bail was $7,000 higher for violent crimes, $13,000 higher for drug crimes and $10,000 higher for crimes related to public order.
Once again, this study is being misrepresented. As the study says in respects for violent crime, “For violent crimes, this coefficient is roughly -$140, suggesting that blacks’ bail is actually slightly lower than whites after regression adjustment, which obviously does not support the hypothesis of discrimination against blacks. For the other offense-type categories, regression-adjusted differences are much smaller than raw black-white differences.” Why this was omitted from the document is unknown, and the coefficient for violent crime seems to show an anti-white disparity, not an anti-black one. For drug crimes and crimes related to public order, the coefficients were much smaller than when just looking at raw data and they were not statistically significant, except for drugs at 0.00.
Death Penalty Sentencing
- https://files.deathpenaltyinfo.org/legacy/documents/WashRaceStudy2014.pdf
- Analysis of 33 years of data from Washington State to determine which characteristics best predict the decision to implement a death sentence.
- Black defendants are 4.5 times as likely to receive a death sentence as similarly-situated whites.
- Other factors (presence of aggravating circumstances, involvement of sex crimes, hostage-taking, etc.) explain only a small fraction of the disparity in prosecutors’ and juries’ decision to invoke the death penalty against black defendants.
- Race was by far the most influential statistical factor.
Contrary to what was claimed, race was not even “by far the most influential statistical factor.” If we look at Table D3 from the study, we see that the beta coefficient was strong, but it was beat out by extensive publicity, white victim, and police officer victim.

Although the beta coefficient was strong, it was in 4th place when we look at the data ourselves. The variable wasn’t statistically significant also, but we will ignore that given that effect sizes are better than statistical significance. This study was misinterpreted, and actually looking at the data gives a different picture, contra Vaush. Percent black was a statistically significant variable, but this can be explained by the high rates of crime among blacks. It’s well known that blacks commit more crime than whites, as pointed out in a giant literature review by Beaver, Ellis, and Wright (2009):

I wouldn’t put much hope into that variable and thinking “ha! Gotcha!” It most likely does not mean much, especially since the U.S. doesn’t sentence people to the death penalty on a population basis.
What was said above doesn’t dispute that blacks are more likely to get the death penalty, but this is not due to race once other factors are controlled for. Focusing specifically on race and implementing the death penalty, Klein and Rolph (1991) note that “After accounting for some of the many factors that may influence penalty decisions, neither race of the defendant nor race of the victim appreciably improved prediction of who was sentenced to death.” Baime (in Systemic Proportionality Review Project: 2001-2002 Term): “[W]e state our conclusions: (1) there is no sustained, statistically significant evidence that the race of the defendant affects which cases advance to penalty trial; (2) there is no sustained, statistically significant evidence that the race of the defendant affects which cases result in imposition of the death penalty.” Baime notes that there is no sustained, statistically significant evidence that the race of the defendant affects which cases advance to penalty trial. Although bivariate analysis reveals that a greater proportion of death-eligible white defendants than African-American defendants advance to the penalty phase, that finding is not supported by regression studies and application of case-sorting techniques. Finally, Corzine, Codey, and Roberts (2007) report that “The available data do not support a finding of invidious racial bias in the application of the death penalty in New Jersey.”
- Analysis of the relationship between racial stereotyping and death sentence convictions.
- Black defendants who possessed darker skin and more “stereotypically black” features were twice as likely to be given the death penalty when accused of murdering a white person, as compared to lighter-skinned blacks with less “stereotypically black” features.
- This disparity disappears completely when the murder victim is black.
Check above to see a response to race of the defender, fits for within-race differences too.
Since claim #1 has been responded to up above, we will move onto the final claim. In general, there is no race-of-victim bias: Walsh and Hatch (2017): “[We] fail to find any race-of-victim bias”; Katz (1989): noted that the discrepancy vanishes altogether when further controls are imposed; Bacon et al. (2003) echoed this finding multiple times: “The race of the victim effect does not hold up, however, at the decision of the state’s attorney to advance a case to penalty trial and at the decision of the judge or jury to impose a death sentence given that a penalty trial has occurred” (p. 27); “The race of the victim does not appear to matter when the decision is to advance a case to the penalty phase or to sentence a defendant to death after a penalty phase hearing” (page 29); “Among the subset of cases where the case actually does reach a penalty trial, the victim’s race does not have a significant impact on the imposition of a death sentence” (page 35); “There is no race of the offender / victim effect at either the decision to advance a case to penalty hearing or the decision to sentence a defendant to death given a penalty hearing” (page 30). Jennings (2014) found no evidence that cases with white victims were more likely to result in the death penalty compared with similar cases involving non-white victims, even when examining the most disadvantaged situations for black defendants.
Implicit Bias
DOES APPEARANCE MATTER?: THE EFFECT OF SKIN TONES ON TRUSTWORTHY AND INNOCENT APPEARANCES
- Photos of capital inmates shown to entry-level criminal justice students for them to evaluate the trustworthiness of the faces.
- Students rated pictures of light-skinned inmates as more trustworthy when they preceded pictures of dark-skinned inmates.
- Most study participants (79.9%) were white, but the study predicted that this wasn’t a major factor – “When controlling for race, no statistically significant result was found. This suggests that each race, White and non-White, were consistent in their rating outcomes. Prior research has found similar results, where Whites and light-skinned Blacks are likely to share similar attitudes towards darker-skinned Blacks
The sample for this study was not representative as the sample came from undergraduates from a single university. Per the study, “Undergraduate students at the University of Alabama in the Criminal Justice Department were used to analyze the photographs of capital case defendants.” The only time dark-skinned defendants were rated as less trustworthy was when they came after a light-skinned defendant, and that’s the only time. It’s unknown why this was the case, but Cohen’s d was large (d=0.8). Regardless, the limited sample restricted to a single university does not allow us to make generalizations about anything.
Black Boys Viewed as Older, Less Innocent Than Whites, Research Finds
- Students and police officers participated in tests to determine levels of racial bias and perception of innocence.
- Black boys as young as 10 are more likely to be considered criminal or untrustworthy, and more likely to face police violence.
- Police officers were tested on dehumanization of blacks by comparing people of different races to animal groups. Police who engaged in higher levels of dehumanization were more likely to use violence against black children.
On the topic of perceiving blacks as older, this can be attributed to racial differences in physical maturation (blacks mature faster than whites). According to Winegerd et al. (1973), “The white-black differences were great enough to provide the basis for an effective discriminant function. The total variation in maturity within the hand (the “disharmony” or “imbalance”) differs in blacks from such variation in the other races.” Moreover, according to Rushton (2000), blacks reach sexual maturity sooner than whites, who in turn mature sooner than Asians. This is true for things like age at first menstruation, first sexual experience, and first pregnancy. One study of over 17,000 American girls in the 1997 issue of Pediatrics found that puberty begins a year earlier for Black girls than for White girls. By age eight, 48% of the Black girls (but only 15% of the White girls) had some breast development, pubic hair, or both. For Whites this did not happen until ten years. The age when girls began to menstruate was between 11 and 12 for Black girls. White girls began a year later. Sexual maturity in boys also differs by race. By age 11, 60% of Black boys have reached the stage of puberty marked by fast penis growth. Two percent have already had sex. White boys tend not to reach this stage for another 1.5 years. Orientals lag one to two years behind Whites in both sexual development and the start of sexual Interest.
Young blacks are also more likely to be criminal than whites. For instance, one report from the US Department of Education found that Black preschoolers are 3.6 times more likely to be suspended than white preschoolers, and black students are 2.3 times more likely than white students to be referred to law enforcement or arrested as a result of a school incident. Another report by the Civil Rights Data Collection remarked that black girls account for 20% of all female preschoolers and 54% of female preschoolers who are suspended more than once. Black preschool children are 3.6x more likely to be suspended than whites. This can not be pinned onto racial bias. Wright et al. (2014) remarked that the black-white suspension gap was completely accounted for by controlling for past behavioral problems, suggesting that the gap is not due to racial bias. Skiba et al. (2002) found the racial gap in suspension rates persisted even after SES was controlled for, and found that whites and blacks had the same chance of being suspended once they were sent to the office. This too suggests that these disparities are not due to bias. Skiba et al. note that “African-American students are referred to the office for infractions that are more subjective in interpretation”, but black behavior in classroom is not the same as white students. Kochman (1983) vividly describes race differences in attitude toward various rule governed social interactions. In formal negotiations, he finds, whites are more interested in following “the rules of negotiating” and “the negotiating procedure,” whereas blacks are more driven by their emotions and see conformity to these rules as defeat (37–42). In turn-taking situations such as the classroom, “the white classroom rule is to raise your hand, be recognized by the instructor, and take a turn in the order in which you are recognized.… The black rule, on the other hand, is to come in when you can.… Within the black conception, the decision to enter the debate and assert oneself is self-determined, regulated entirely by individuals’ own assessment of what they have to say ” (24–28).
Marcus (2007) found that “Blacks showed from 13% to 78% greater involvement than Whites for all forms of aggressive and violent behavior, whereas for feeling unsafe at, or to or from, school showed 123% more Blacks felt unsafe than Whites. Racial-ethnic differences of this magnitude have been reported in other national surveys that were roughly similar.” Johnston et al. (2008) noted that based on various questionnaires, blacks self-reported being about 10 percent more violent than whites. Hartup (1974) had a group of observers rate children on their aggression levels. Particularly in instrumental aggression, older black children were more aggressive than older white children. There was likely a difference in hostile aggression as well, but it was not detailed. There was a Race x Age interaction – the differences between whites and blacks were small at a younger age and grew as the groups were older. Mayberry and Espelage (2005) found that the aggression differences between blacks and whites are larger in reactive aggression (the hostile component). If we average the means and SDs for black females and males and white females and males, and we use the white avg. SD (which is very similar to the black avg. SD), then we find black people are 0.5833 white SDs higher in reactive aggression than whites are. This is certainly large enough to be consequential. These results can also not be pinned onto racial bias by teachers via their student assessments (Chang and Sue 2003).
As crazy as it may sound, officers are correct in assuming that blacks, even at a young age, will be more criminal than white — especially given racial differences in behavior. When it comes to IAT tests in general, there are a lot of problems with them. One doc, like Vaush’s, argues that IAT tests are valid because they have predictive validity — also known as the ability to predict real world behavior. To support this, Greenwald et al. (2009) are cited as support. Unfortunately for them, a re-look at Greenwald et al. found them to be only weak predictors (Oswald et al. 2013). The test also has a low test-retest reliability (Nosek, Greenwald, and Banaji 2005), further casting strong doubt on its validity (see Blanton et al. 2009 for more). So even though the IAT is a flawed test, police officers are still right in their assumptions about black criminality. Even if the IAT was a sound test, though, police officers would still be right.
- Racial Bias in Judgments of Physical Size and Formidability
- Results from three separate studies on perception and racial bias show people have a tendency to perceive black men as larger and more threatening than similarly sized white men.
- Participants also believed the black men were more capable of causing harm in a hypothetical altercation and police would be more justified in using force to subdue them, even if the men were unarmed.
According to Johnson and Wilson (2019), stereotypes based on physical attributes are accurate. Even then, blacks are more threatening, are more likely to cause harm, and are more violent — as noted up above. Not much to be said here.
Sex Reassignment Surgery
Like what has been said above, an update to this response includes a talk on the validity of sex reassignment surgery (SRS, henceforth). In Vaush’s Google document, the claim is made that SRS has a “has a positive effect on trans people.” The science used to support this claim is based on poorly done studies, so we can not definitely claim that SRS has a positive effect on trans people. Due to the issue of small samples, lack of controls, and sampling bias prevalent in this studies we can not make any claims that fit the population we are looking at. Although the studies do show positive effects, they are not representative and thus worthless for generalized claims.
- Longitudinal study on the effectiveness of puberty suppression & sex reassignment surgery on trans individuals in improving mental outcomes
- Unambiguously positive results – results indicate puberty suppression, support of medical professionals & SRS have markedly beneficial outcomes to trans individuals’ mental health and productivity.
In this study, it was found that SRS has a positive effect on transgender individuals, with SRS improving their psychological well-being. This study, though, had a tiny sample size of 55 transgender youths and was not a random sample. The sample came from referred adolescents, which can lead to self-response bias. Furthermore, there was a large number of participants– at least in the context of this small sample size — who dropped out of this study (10 dropped out, so the new sample is 45). According to Table 2, there was a decrease in their sample size from the first wave to the third one:

It’s hard to know if there was even any actual large effects on SRS on the samples well-being due to the lack of a control group to compare the sample to, and because of the small sample size which can lead to misleading results. The researchers also did not separate the effects of puberty suppressors and SRS, so we do not know which one lead to a lower mean in T2. Although this study did find positive effects, the small sample size, the non-random sample, and lack of control group does not allow us to make any generalized claims on the effectiveness of SRS. The study only tells us that puberty suppressors/ SRS had a positive effect on the 45 people in this study, and thus can not be used to make any generalized claims since it’s not a random sample.
- Meta-analysis of studies concerning individuals who underwent sex reassignment surgery
- 80% of individuals reported significant improvement in dysphoria
- 78% of individuals reported significant improvement in psychological symptoms
- 72% of individuals reported significant improvement in sexual function
Murad et al. (2010) looked at 28 studies with a sample size of 1833 participants and found that SRS had a positive effect. Even without knowing how many studies were looked at and the sample size, Vaush’s summary of it lets readers know that SRS does work — but he leaves out how badly done these studies were.
None of the studies were RCT and only 3 of them had a control group, but one of those 3 studies had a control group in which the control group did not fit the criteria for those with Gender Identity Disorder. The exposure to hormone therapy in some of the studies looked at were self-reported, and “the details of treatments were in general not reported.” 23 of the studies reported SRS as a whole (hormone therapy + SRS), so it was hard to separate the effects of hormones and SRS. 21 of the studies assessed outcomes via a structured interview or clinical exam, 7 studies used a questionnaire, and 1 used an internet survey.
Looking at Table 1 of the study shows that a large portion of these studies had high dropout percentages. Many of these studies had small sample sizes, and the authors do not tell us the type of sampling used, so it’s hard to know if the samples were representative or biased. Regardless, the authors note that “In most of the included studies, at least two thirds of individuals with GID reported improvement in some aspects of their quality of life such as more stable relationships, better adjustment, satisfaction with sex reassignment, and overall happiness and contentness.” Furthermore, even the authors admit these studies were poorly done:
The evidence in this review is of very low quality due to the serious methodological limitations of included studies. Studies lacked bias protection measures such as randomization and control groups, and generally depended on self-report to ascertain the exposure (i.e. hormonal therapy was self-reported as opposed to being extracted from medical records). Our reliance on reported
outcome measures may also indicate a higher risk of reporting bias within the studies. (p.229)
Even if one did not want to read the paper, the same thing was also said in the abstract. The abstract notes that “All the studies were observational and most lacked controls”, and that “Very low quality evidence suggests that sex reassignment that includes hormonal interventions in individuals with GID likely improves gender dysphoria, psychological functioning and comorbidities, sexual function and overall quality of life.”
So, although the studies did find positive effects, this could be due to most of the studies having small samples, possible social desirability bias, and lack of controls. It’s also unknown if the researchers relied on p-values instead of effect sizes, so we can’t really know if there was a difference in psychological and social variables; combine that with the lack of controls, the fact that none of the studies were RCT, and you have poorly done studies that tell us that SRS works. Although one may say “Ah! So they do work,” the fact that they’re poorly done doesn’t help. It’s unknown if the samples were random, which does not allow us to see if the results are generalizable. So, it shows that poorly done studies show positive effects, but not that they’re generalizable due to the lack of sampling details.
- https://www.jaacap.org/article/S0890-8567%2816%2931941-4/fulltext
- Children who socially transition report levels of depression and anxiety which closely match levels reported by cisgender children, indicating social transition massively decreases the risk factor of both.
Luckily for us, this study allows us to calculate an effect size since it has a control group to use as a comparison. The study and Vaush’s summary of it is correct, but the authors rely solely on p-values. As has been noted in the statistics section up above, when looking at group differences, we should use Cohen’s d, not rely solely on p-values. Table 2 gives us the supplementary data we need to calculate d, and it does show there are differences between transgenders and the control group in anxiety and depression, contra what the authors and Vaush say.

Let’s use the M, SD, and n from the table above to see if the difference between transgenders and the control group is clinically significant. To see if effect sizes are clinically significant, they must be .24 or larger (see Cuijpers 2017).
| Variable (All participants) | Cohen’s d |
| Depression | 0.26 |
| Anxiety | 0.34 |
| Participants w/ Family Income <$75,000 | |
| Depression | 0.06 |
| Anxiety | 1.2 |
As can be seen, there is a difference between transgenders and the control group. This shows that even after transitioning, transgender individuals still have higher depression rates and anxiety rates, contrary to what the authors argue since they rely solely on p-values. When looking at the sample who have a family income lower than $75,000 there is no difference in the depression rates between transgender individuals and the control group (this could be due to the small sample size for this cohort, which was 18 for transgenders and 13 for the controls, but it’s unknown why an effect is found when looking at anxiety). In looking at anxiety rates, there is a large difference, showing that transgender youths under an income of $75K score much higher than the control. Overall, this study does show differences even after transitioning. This study does not support what Vaush is arguing for, nor does it support the authors conclusions when looking at effect sizes.
- https://www.eurekalert.org/pub_releases/2015-03/tes-sdc030615.php
- “A new study has confirmed that transgender youth often have mental health problems and that their depression and anxiety improve greatly with recognition and treatment of gender dysphoria”
Honestly, I am not sure why this was included. The Vaush document does not link to the study itself, but rather a press release detailing the findings of the study and when it’s to be presented. Doing a Google search for this study brings up no results, and the study seems to suffer from a small sample size and response rate. Originally, they started with 42 participants (the Eureka site does not say if there was a control group) and then fell to 26 during a follow-up, but only data for 22 of those participants were available. What are we to make of this study? Nothing. No actual study is given, no information on sampling method, no talk on if there was a control group or anything. This study does not help us at all.
- Longitudinal study which indicates transgender people have a lower quality of life than the general population.
- However, that quality of life raises dramatically with ‘Gender Affirming Treatment’, the nature of which is detailed extensively in-text.
Like the Murad et al. (2010) study, this study basically repeated the same problems as the prior meta-analyses. As the study says, “The majority of studies (n = 23) recruited transgender people through clinical services” and “The remaining five studies recruited participants through opportunity sampling, word of mouth, flyers, advertisement and through community outreach.” So, we have an issue of sampling bias. This already does not allow us to generalize any of their results. Of the 29 studies looked at, only 3 had samples higher than 300 and the majority of the studies reported a response rate lower than 70% or did not offer information on it, thus increasing the risk of sampling bias. 2 studies had a low risk of bias, 20 had a moderate risk of bias, and 7 had a high risk of bias. The majority of these studies also lacked controls. Even those who do not want to read the paper fully can take what the abstract says: “The majority of the studies were cross-sectional, lacked controls and displayed moderate risk of bias”, and “Better quality studies that include clearly defined transgender populations, divided by stage of gender affirming treatment and with appropriate matched control groups are needed to draw firmer conclusions.”
- ENORMOUS meta-meta-analysis on transgender people and the effect gender transition has on their mental health
- Of 56 studies, 52 indicated transitioning has a positive effect on the mental health of transgender people and 4 indicated it had mixed or no results.
- ZERO studies indicated gender transitioning has negative results
- This pretty much ends the argument right here.
This was not a meta-analysis, and I don’t know why Vaush or the people who cite this study still call it a meta-analysis. Meta-analysis give effect sizes like Cohen’s d, Pearson’s r or something else, but the Cornell article did not do this. Instead, it’s just a systematic review of the literature, not a meta-analysis. That’s just a nitpick, but these studies still suffer from the same issues as the actual meta-analysis up above.
Of the 52 studies finding a positive effect, one of them have to be excluded due its nature. Padula, Heru, and Campbell (2015) was simply an attempt to model the mathematical cost/ benefit of gender transitioning, not anything that actually provides original research on the effects of SRS. This leaves us with 51 studies, which is still a lot, but the rest still have problems. 5 of the largest studies cited by Cornell suffer from problems. Bailey, Ellis, and Mcneil (2014) was a narrative analysis that utilized an online survey and that was promoted by LGBT groups and support organizations. The method of getting there sample was not random, and is guilty of non-response bias. Due to the nature of their self-selected survey, it offers nothing to make a generalized claim since it is not a random sample. St. Amand et al. (2011) got their sample from “online groups and discussion forums that were dedicated to FTM [female-to-male] members…” Again, not a random sample, suffers from non-response bias, and thus can not be used to make a generalized claim. Ironically enough, Vaush criticized a study for using a internet survey and for going on sites that were biased for their sample, and thus would lead to skewed results. To quote Vaush, “those polls were taken online, and those sites were biased by nature – ‘4thwavenow, transgendertrend, y*ls’. Horrendously, pathetically inept data collection. Anyone who cites this should be laughed at.” Why these studies using internet surveys and biased sampling methods are good but the one he critized isn’t is unknown.
Moving onto the other 3 studies, Newfield et al. (2006) recruited their sample via flyers and postcards in the San Francisco area, and of the larger studies with 573 people, their sample came from recruited “through purposive sampling by identifying community spaces and venues where transgender women congregate (e.g., community-based organizations, bars, and nightclubs) and posting flyers” (Glynn et al. 2016). If you’re smart enough to know the common trend with these studies, then you’d know that a purposive sample is not a random sample and thus can’t be used to make generalizations about the effects of a variable on a population. Djehne et al. (2014) was probably the most rigorous of the 5 largest papers and had a large sample size, with the study founding a very low regret rate for SRS. The thing is, the study undercounted the regret rate as its definition did not count those who were unhappy with their transition but chose not to reverse it. Nor those who ended up getting depression or addiction, or those who were unhappy after the transition. Nothing is said if the studies controlled for confounding variables, or if there were any control groups. Due to this, the study really does not help much.
Many of the smaller stuff had similar problems as their 5 largest ones. For example, Boza and Perry (2014) had a sample that was self selected (self-selection bias), so it is not at all representative. Another study used a self-selecting sample of people from forums dedicated for those who were FtM (Meier et al. 2011). Giving an entire discussion on all the studies cited by Cornell is a topic for another day, and hopefully one day a post of its own. To summarize a long story (from Blake 2019), many of the clinical studies lacked control groups, did not control for confounding variables, and had non-representative samples. Even those that were not clinical studies had samples that were not at all representative. Citing the Cornell article does not “pretty much end the argument”, it just shows that all these studies looking at the effect of SRS are poorly done.
Horvath (2020) reviewed the Cornell review and found that multiple systematic review guidelines were violated by the Cornell analysis. Using the AMSTAR-2, which is 16-item checklist used to see if a systematic review is unbiased, comprehensive, and systematic, and the PRISMA which checks for transparency and consistency, it was found that the Cornell review failed to be a truly unbiased, accurate review.
Viewers of Vaush, or Leftists in general, might’ve noticed that I did not cite any papers showing that SRS doesn’t work, and that’s because that’s not a position I take. Although there does seem to be a “consensus” that SRS does work, it does not allow us to make generalizations onto the transgender population as a whole. The fact that these studies are poorly done, and even meta-analysis’ suggests this, just shows the science on this is not settled. We need studies with controls, random samples, and those that control for confounding variables. Until then, the science is just too poor to come to an accurate conclusion.
I am not alone in this. In a review done by Arif, they found the the research on transgenders are poorly done. Their results found that there was a lack of a good quality, systematic review of the research literature, most studies were without a control group, and not blinded, high drop-out rates of study participants (some over 50 %). More research is needed, but until then we can’t make any conclusions about these findings to the transgender population as a whole.
Transgenderism & Suicide Rates
- 2018 LGBTQ Youth Report
- HUGE collection of data concerning difficulties LGBTQ people face
- 67% of LGBTQ youth hear their parents make negative statements about LGBTQ people – rises to 78% if child is in closet.
- 48% of LGBTQ youth say their family makes them feel bad for their identity
- This pretty much ends the argument right here.
- https://www.ncbi.nlm.nih.gov/pmc/articles/PMC5178031/
- Broad international study of trans suicide rate (it’s quite high).
- “Gender-based victimization, discrimination, bullying, violence, being rejected by the family, friends, and community; harassment by intimate partner, family members, police and public; discrimination and ill treatment at health-care system are the major risk factors that influence the suicidal behavior among transgender persons”.
- https://williamsinstitute.law.ucla.edu/wp-content/uploads/AFSP-Williams-Suicide-Report-Final.pdf
- Massive demographic analysis which codifies the many social & institutional factors which contribute to trans suicide rates
- Surprise surprise, discrimination & abuse play a huge role. Read the summary.
- http://transpulseproject.ca/wp-content/uploads/2012/10/Impacts-of-Strong-Parental-Support-for-Trans-Youth-vFINAL.pdf
- Analysis of the ways in which parental support affect elements of disadvantage experienced by transgender youth.
- Most notably, strong parental support decreases the likelihood of a suicide attempt within the past year from 57% to just 4%.
- https://link.springer.com/article/10.1007%2Fs13178-018-0335-z
- LGBTQ youth are 120% (2.2x) as likely to experience homelessness as cisgender and heterosexual youth.
- Up to 40% of the homeless youth population is LGBTQ
- Cited possibility for this discrepancy being LGBTQ youth getting kicked out of the home by unwelcoming/openly hostile family.
- https://en.wikipedia.org/wiki/LGBT_employment_discrimination_in_the_United_States
Originally, this post was not going to include a discussion on oppression being responsible for the high suicide rate among transgender people. Luckily, Last (2020) reviewed the literature on stigma being responsible for the high suicide rate among trans people and remarked that,
Reviewing all the literature I could find on the association between suicide and non-violent discrimination among trans people (22 effects), I found, in the first place, that the effect sizes reported were generally small, especially in larger studies. Among studies with at least 1,000 participants, experiencing non-violent discrimination predicted a roughly 10% increase in suicidal behavior. Obviously, this can’t contribute much to any explanation of why it is that trans people are roughly 900% more likely than cis people to attempt suicide. Moreover, a majority of these effects (64%) were not statistically significant, so that most of the research did not find that non-violent discrimination significantly elevated suicide risk among trans people.
I found something similar when looking at 22 reported associations between a lack of social support and suicide, with the effect sizes being very weak, meaning that can’t possibly explain more than a tiny fraction of the association between transgenderism and suicide, and once against the effects were statistically insignificant most (78%) of the time.
The data concerning physical violence is less clear. Across ten effects, the link between physical violence and suicide was more consistently statistically significant. However, the size of the effect reported varied a great deal between studies. The degree to which experiencing violent discrimination elevated suicide risk ranged from 1.43 to 4.72. Moreover, there was an tendency for larger studies to find smaller effects. The largest study I found reported odds ratios of less than 2.
in Last (2020)
Readers are recommended to read the Last article as he discusses this in-depth.
Transgenders in Sports
- Meta-analysis covering prior research on trans individuals’ performance in sports and preexisting sports policies concerning trans people
- Findings show there is no consistent or direct research indicating transgender women have an unfair athletic advantage at any stage of their transition.
- Additional findings show most sports policies are not evidence-based and trans individuals experience substantial discrimination from sports institutions.
Again, this was not a meta-analysis! It’s a systemic review, and even the title of the study says this! The researchers looked at 8 studied that met their criteria and found that transgender women aren’t at an advantage in sports. I’m not sure how this systemic review can be taken seriously given the fact that majority of the studies have small sample sizes. The first study was Caudwell (2012), with a staggering sample size of 2 people. This sample just doesn’t help us at all. The 2nd study used was by Cohen and Semerjian (2008), and this study was literally about 1 person. Again, doesn’t help us. Hargie et al. (2015) had 10 people. Semerjian and Cohen (2006) had 4 people. Tagg (2012) had 2 people. Travers and Deri (2011) had 12 people. Studies with small samples can still offer us some insight, but these sample sizes are very (x400) tiny.
There was only 2 studies that had n>12, and one of them was Muchicko et al. (2014) with a sample of 80 people. Although their sample was okay, their trans cohort was 33 people. That’s a very small sample, and their sample was “surveyed at a large, public mid-western American university and additional support groups for transgender individuals in Akron, Columbus and Cleveland, Ohio.” How many of these trans participants came from the university and how many from the support groups? The authors do not say, but the small sample of trans people and the non-random sampling doesn’t allow us to make generalizations. The 2nd study was Gooren and Bunck (2004), with a sample of 36 people. The CIs in this study are incredibly wide, and that’s bad when you consider their sample was only 36 people.

How Vaush and his followers can take this seriously is astounding. Majority of the studies in this study had samples smaller than 12 people, and small samples do not help us because they aren’t representative. The last two studies where n>15 were poor, with one having a sampling method that was biased and a small cohort of trans people, and the last one had wide CIs. None of the studies here help us.
Whether trans people do or do not have an advantage in sports is not something that’ll be taken up here, but the study Vaush uses to support his position is poor.

Pingback: A Response to Vaush’s Ultimate Research Document: Racism in the Criminal Justice System | Race & Conflicts
Pingback: Vaush: Ultimate Research Document Rebuttal 2.0 – House of Wagner
Took me a couple days to read through this all. Quite impressive work. This was absolutely wonderful. I will try to share it a bit.
There were a few points I thought I had some information to add, but then you elaborated and it turned out you’d already found the study I was going to point out.
I did find one matter on which I thought I could add something. Your discussion of “driving while black” and statistical discrimination could probably be buttressed slightly. For the statistical point regarding how it can be the case that blacks “are found to have” lower rates of drugs during searches, yet actually use drugs at higher rates, a philosopher studying at Cornell perhaps explained the point slightly differently here: https://necpluribusimpar.net/fallacy-people-often-commit-accuse-police-racism/ He’s not responding to Vaush, but to roughly the same studies and discussion.
(Also, for the normative issue David Boonin’s book “Should Race Matter” has a nice discussion of statistical discrimination in the final two chapters. He ends up supporting racial profiling after discussing the issue back and forth for a while.)
This is one of the most impressive posts I’ve seen on the internet recently. Thank you for putting in the hard work on this one.
LikeLiked by 1 person
This is a wonderful post, excellent analysis.
LikeLike
Vaush’s actually borrowed a huge chunk of a research document done by leftist youtuber named Rose Wrist. Rose Wrist’s document has more studies around race than Vaush, which you can criticize. Here is the link:
https://docs.google.com/document/d/1OIVHtml45EcMSi3suI5Zn1ymef5Y-8hnHbeY6kxp-ec/edit
LikeLike